Monday, March 7, 2011

As Silver Continues to Soar, This Miner Is Just Beginning Its Monumental Move


By John Townsend, The TSI Trader


Coeur D’alene Mines Corp (CDE:NYSE $34.70) is just beginning its monumental move. I believe we may see its share price double in the next 8 – 12 weeks.

This article will provide you with an update of silver’s current parabolic move; detail the underpinnings of Coeur D’alene’s incredibly strong fundamentals going forward into 2011, and expose the powerfully bullish technical outlook for its stock.

Click on the chart to ENLARGE

Silver is presently making its fifth parabolic appearance of this secular bull market for precious metals. Our first chart is a weekly look at the World Silver Index (XSLV) dating back to 2004 and including the three previous silver parabolic moves of 2004, 2006 and 2008. The 40 week moving average is shown as a proxy for the 200 day moving average.

One of the metrics to observe is the degree to which a silver parabolic ultimately rises above its underlying 200 dma. Another consideration is the length of consolidation time that precedes the parabolic move. When I combine these two metric considerations and apply them to our current silver parabolic, it is apparent that silver’s price rise above its 200 dma could match or exceed 65%. This projects a silver peak in excess of $50. In fact, as the consolidation preceding our current parabolic has been massive, $50, in retrospect, may turn out to have been too conservative.

 This second weekly chart of XSLV considers our current parabolic using a different metric – the midpoint consolidation. There is a tendency for parabolic moves to exhibit a resting point that divides the move into two equal legs. And we observe that silver has now cleared its consolidation phase at the $32 level and is headed towards a completion of this pattern at $48.
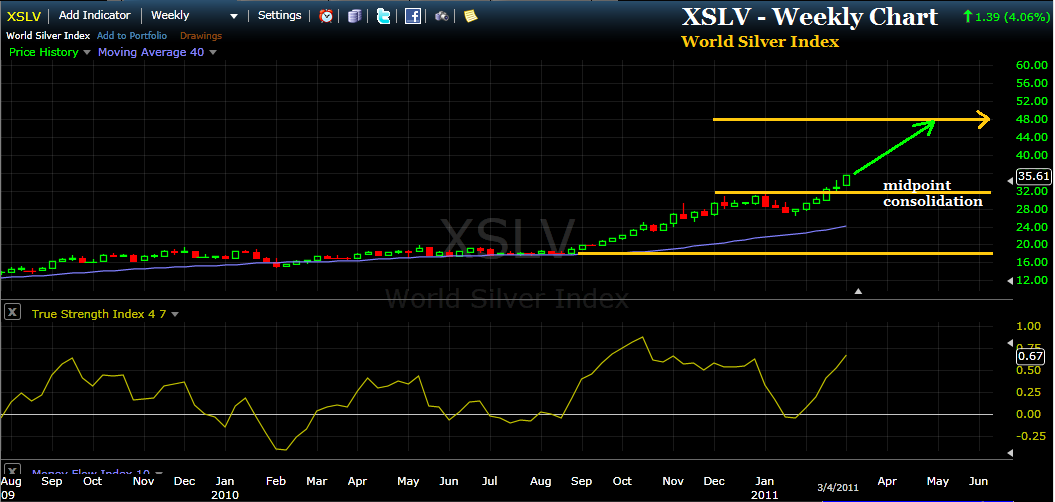

Click on the chart to ENLARGE

The takeaway from these observations is not to argue just how high silver will soar, but to simply note that silver is going much higher, quickly and now.


Coeur D’alene (CDE) is poised fundamentally to skyrocket right along with silver. The company has three mines that are now in full production and the 2010 Q4 results announced last week revealed that analysts were significantly underestimating the company’s new earnings power. Analysts expected the company to earn 33 cents per share and instead the company reported quarterly earnings of 56 cents per share.


Some highlights of Coeur D’alene’s key fundamental data include: $3 Billion market capitalization, shares outstanding 89 Million and holding flat, selling at 1.5X book value, 2011E Price to Earnings ratio of 12 (which is about half the average PE of other large silver miners), and 2011E Price to Cash Flow ratio of 7 (also about half the average of comparables).


Consensus estimated earnings for 2011 are $2.28 per share vs. 2010 $0.39 actual earnings per share. Cash flow from operations (chart below from the Coeur D’alene website) is expected to more than double in 2011 from 2010.

Click on the chart to ENLARGE

Debt levels are trending downward quarter after quarter while cash levels are trending strongly upwards. For 2011 the company projects that capital expenditures will decline, while production of both silver and gold will increase, as will sales.


Regarding the issue of hedging the CEO, Dennis Wheeler, commented during last week’s conference call, “I just want to make it clear that Coeur has the policy of non-hedging in silver production. We know that our investors like you are believers in the continued price appreciation of silver and gold and we want our investors to be able to maximize their investment and leverage to the metal so we will not be hedging any of our silver”.

 To summarize current and projected CDE fundamentals, it is somewhat difficult for me to imagine a more ideal setup. Projected earnings and cash flow growth are explosive, current market valuations in terms of book value, price to earnings and price to cash flow are in the silly cheap category, and last quarter’s performance puts the sting to any who may have doubted Coeur D’alene’s ability to deliver. I should add that ownership of CDE shares is literally a list of the ‘who’s who’ of investment heavyweights – ETFs GDX and GDXJ, as well as Van Eck, Dimensional, Vanguard, State Street, JP Morgan Chase and Blackrock.


The following weekly chart of CDE reveals that several months ago stock price broke above a 5 year long down trend resistance line, has since consolidated above this line after a successful retest, and is now continuing higher.

Click on the chart to ENLARGE

The chart also details the significance of the $28 price level which was a support level for CDE price from 2004-2008 and has since 2008 been a resistance level. Until last week that is, when CDE took on that $28.00 price level and blasted right through it, closing the week at $34.70. Technically speaking, this is the recipe for beginning a monumental move.

The 2004 and 2006 silver parabolic moves took CDE from being a $28 stock to the $75 neighborhood and quickly. As I believe the current silver parabolic is likely to surpass the magnitude of each of the four preceding silver parabolics, the fundamental underpinnings of the CDE stock are nothing short of both impressive and ideal, and the technical setup is exactly as one would hope, I consider it a realistic possibility that CDE could again achieve a $75 price target before the current silver parabolic expires.

 One final thought with a chart. The overhead resistance (selling pressure) should be reasonably mild as CDE has not traded any shares above $28 for three years or so. Not all, of course, but most sellers of the shares now are sitting with a profit and are not particularly motivated to sell provided price continues higher. And for that matter, this chart shows us that shareholders who bought 4 and 5 years ago are not holding a lot of shares anyway.


Click on the chart to ENLARGE

Disclosure: I own CDE and look forward to participating with CDE throughout the concluding leg of this silver parabolic.

 I wish you a great week of trading and invite you to peruse my website, The TSI Trader, where you will find a focus on both the techniques of using the True Strength Index (TSI) indicator for accurate trading signals and the secular bull market for precious metals.


John Townsend

tsiTrader@gmail.com


Gold: A Very Good Question

Click on the chart to ENLARGE
*
Overnight gold made a new all time high, reaching $1,444.70.  Which now begs a very good question.  Did the daily cycle really top on Day 22 and bottom the following day, OR, is gold making a stretched daily cycle and still working on making a top (today is Day 25)?
*
If Day 22 was the top, gold would appear to be entering a runaway move.  If today or some day soon gold tops then we should expect it to decline to make a daily cycle bottom.
*
The answer?  Your guess is as good as mine.
*
In either case, it is upwards we go - continuing today or in a few days.
*
My page Tomorrow's Trades (Today!) has been updated for today's trading session.

Thursday, March 3, 2011

Looks like a Gold Daily Cycle Top

*
This is a daily chart of the World Gold Index (XGLD) spanning the timeframe of the previous intermediate gold cyle begun July 28 to our present day. 
*
Click on the chart to ENLARGE
*
Yesterday gold reached $1441 and appears to have peaked on day 22 of the current daily cycle. 
*
The first daily cycle of the previous intermediate cycle was only 19 days and concluded with a very brief touch of the 20 dma.  The following daily cycle concluded in 25 days with again, a very brief touch of the 20 dma.
*
If the current daily cycle were to conclude in similar fashion, with a touch of the 20 dma, price would likely fall to somewhere around $1385-1395.  And likely bounce right back up off that price level.
*
So perhaps we get a vicious spike that acts like a bolt of lightening (ala 9/28/10) or it takes a few more days to saunter lower, the next daily cycle should be starting shortly thereafter and take us to new all time highs.

Wednesday, March 2, 2011

Sold BAA - $3.60 Buy SVM - $14.10

*
I made two trades today, a buy and a sell.
*
This is a 4 hour chart of Banro Corporation (BAA) which I sold at $3.60 per the price I had set in Tomorrow's Trades (Today!).
*
Click on a chart to ENLARGE

*
And this was my purchase of Silvercorp Metals Inc (SVM) at $14.10...also per the price I had set in Tomorrow's Trades (Today!).
*
The big winner today was US Silver - up 14.10%.  I tried and tried to get an accepted order before the market opened today for USSIF and for some reason my broker's continual message was something like "this trade can only be closed".  What is that all about?
*
Oh well.  Silvercorp should work out just fine.
*
My TSI Trading record has been updated.


8 Miners Whose Overhead Resistance Has VANISHED

*
I have been looking forward to writing this post for some time now.  I knew (believed) this day would come and it is finally here.
*
As gold and silver have now made new all time highs, the list of miners also making new all time highs is just beginning to take shape.  I expect this list will grow considerably over the next couple of months, but here are the early leaders in the race for reaching heights never before seen.
*
Indeed, this present list would be longer if I included miners with short track records.  But I wanted to show you those miners that have labored long and hard to get where they are today.
*
The standout ETF is Proshares Ultra Silver (AGQ) and for those unfamiliar with this product, it is an ETF that is leveraged to perform twice the price movement of the silver metal itself.
*
Click on any chart to ENLARGE
*
In alphabetical order, here are the 8 miners that presently have absolutely no overhead resistance. The earnings data included was assimulated from Bill Matlack's March 1 report published by Kitco.
*
1. Allied Nevada Gold Corp (ANV)
2010 .28
2011E .51
2012E .87


*
2. Claude Resources Inc (CGR)
2010 .10
2011E .19
2012E .24


*
3. Endeavor Silver Corp (EXK)
2010 .08
2011E .36
2012E .41


*
4. Iamgold Corp (IAM)
2010 .76
2011E 1.38
2012E 1.30


*
5. Paramount Gold Mining Corp (PZG)
2010 .28
2011E (.03)
2012E --


*
6. Richmont Mines Inc (RIC)
2010 .31
2011E .61
2012E .73


*
7. Silver Wheaton Corp (SLW)
2010 .75
2011E 1.61
2912E 1.61


*
8. Silvercorp Metals Incorporated (SVM)
2010 .37
2011E .44
2012E .82


My TSI Trading record.

Also, Tomorrow's Trades (Today!).

Tuesday, March 1, 2011

BUY ANO - $1.34

*
I made just one purchase today.  This is a daily chart of Anooraq Resources (ANO) which I bought for $1.34.  Platinum has rebounded considerably since it got slugged in the gut a week ago - yet curiously the platinum mining stocks have lagged.  Perhaps not for long, I hope.
*
Click on the chart to ENLARGE
*
This chart does have a nice trend line break on both the True Strength Index (TSI) and Money Flow Index (MFI) indicator.
*
My TSI Trading record has been updated.
*
The page with Tomorrow's Trades (Today!) has been updated.
*
3 of the first 8 trades have closed for a cumulative gain of 16.01% and average of 2 days per trade.
*

Sold CDE premarket - $31.75

*
I had a sell limit order in place for my shares of Coeur D'alene Mines Corp (CDE) at $31.75 which was taken out in this morning's pre-market activity.
*
Click on the chart to ENLARGE
*
Overnight the US Dollar made a fresh new low (76.76), though at the moment is rebounding somewhat.  Gold inched higher reaching 1422.1, a new recent high and a clear break above the downsloping trend line extending from the all time high of 1432.5.  Silver is making all time highs at 34.475.  Platinum, palladium and copper have each advanced strongly overnight as well.  The weakness in the US Dollar is becomming more and more inevitable as it has fallen below its previous daily cycle low and the rocket launch for the precious metal complex is just getting started.
*
My TSI Trading record has been updated.