Wednesday, February 29, 2012

BUY TVIX @ $16.25


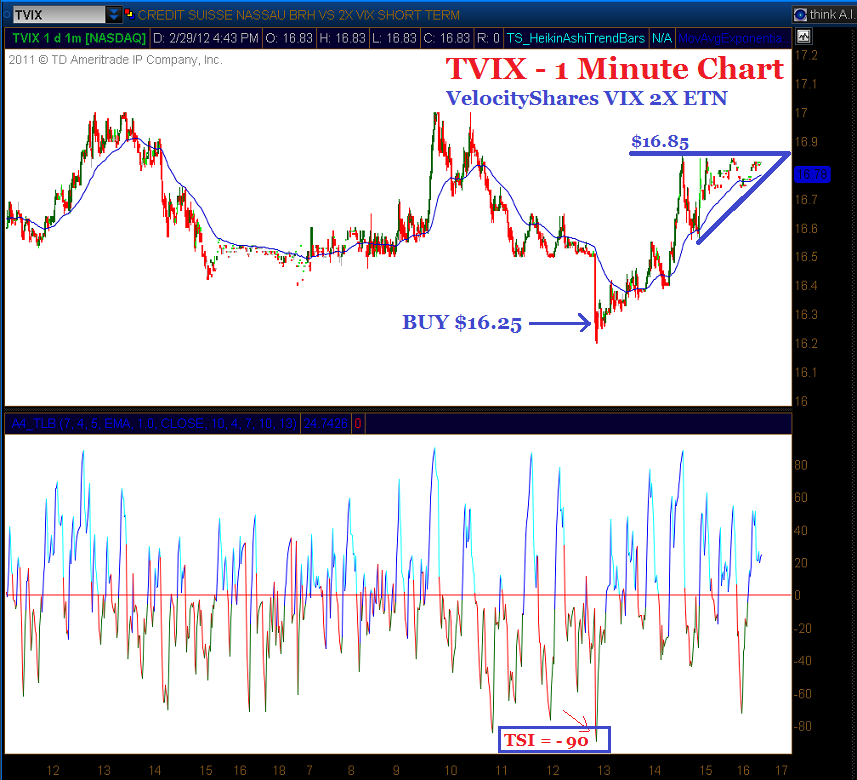
I decided to take a new position in VelocityShares VIX 2X ETN (TVIX) at $16.25. By luck I managed to buy just 5 cents above the low for the day. The True Strength Index (TSI) indicator read -0.90 at the moment of my purchase. Usually these kind of extreme negative readings lead to a bounce in price. Anyway, this is the chart I made just after my purchase.


Click on any chart to ENLARGE

I made this second chart of TVIX a few minutes ago to show where price traveled after my purchase and also to suggest that TVIX appears to be giving some thought to breaking out above $16.85. We shall see tomorrow.

And finally, I made this daily chart of the SP-500 with the TSI (7,4). The blue rectangles show where the TSI indicator has spent time below ZERO with the SP-500 carnage just overhead. Sometimes the correction is begun as the TSI flits like a butterfly just above and below ZERO. Other times a single sharp downward spike is all it takes. If the SP-500 were to drop another 6-7 points, as it did today, that would be enough to create a trend line break and the bears may just decide it is game on - finally.


My TSI Trading record has been updated.


Friday, February 24, 2012

BUY/SOLD DUST - $28.65/$29.60


I've been watching a couple of different setups take shape on various stocks and when the 1 hour chart of Direxion's Gold Miner 3X Bear ETF (DUST) showed me what I was waiting for, I bought shares at $28.65.


It's particularly nice to find a setup where more than one TSI technique BUY signal is active. In this case, there were three - the trend line break, the positive divergence and the ZERO crossover. Additionally, I am gravitating towards finding trend line break BUY signals that are defined not by just two points that provide a slope that is subsequently broken, but three. In fact, I have come across trend line breaks that include four and even five points and the outcome of these setups is quite impressive.


This is the chart of DUST just after I made my purchase. The second chart was made just after i sold my position. I could see that DUST was not likely to make much if any progress before the close so I just took my money and passed the shares off to the next trader.


My TSI Trading record has been updated.


Click on any chart to ENLARGE


Wednesday, February 22, 2012

Sold USSID @ $2.40


I sold my shares of US Silver Corp (USSID) today at $2.40 and am now entirely in cash. I continue to be wary of a stock market correction that will bring mining shares down with it and have patiently sold each miner I owned at a small profit and left the playing table. 


My retirement account, which is another matter altogether, will continue to hold both Claude Resources (CGR) and US Silver (USSID) until something closer to their fair value is recognized by the market.


My TSI Trading record has been updated.


Click on the chart to ENLARGE


Monday, February 20, 2012

VIX - How Low Can You Go?


Since I've had a little success trading VelocityShares 2X VIX ETN (TVIX) I thought a little homework on the subject of the volatility index VIX may help me grasp some fresh perspective. I decided to see if I could get a sense of the degree to which the VIX has been able to stray below its 100 and 200 dma over the past 20 years. And while I was looking at the VIX, I figured I may as well investigate how high the ES - E-mini S&P futures contract has been able to soar above these same moving averages during the same time period.


This project is a good example of the 'reversion to the mean' trading concept that says that price is usually only able to stray just so far from a moving average (mean) before it is pulled back towards the moving average. And in extreme cases, it can also illustrate the rubber band concept that says if price gets too far from the mean, when it finally can only be stretched so far in one direction and that is it, price releases its energy with a very sharp and swift reversal of direction.


For my assignment I chose to use an indicator I created several weeks ago for the ThinkorSwim platform. The indicator is flexible in allowing me to choose any ticker symbol and any moving average length of its price movement, then display the relationship between price and that moving average. 


This first chart is of the VIX on the top, ES on the bottom, both as viewed on a 20 year weekly with a 20 wma which roughly equates to the 100 dma, and with my indicator below price. The black horizontal line measures 1 on the far right and this represents the 100 dma. A reading of 1.25 is 25% above the 100 dma, and so on.


Notable in this first chart is the VIX reaching highs of 185 and 230% above its 100 dma 3 times in the past 4 years. And what I was most curious to see was how much below this mean was possible. We can see that in the past 20 years the VIX has only a few times reached 25% below the mean (0.75). And using this metric, the VIX attained a 20 year low just the other week.


The lower portion of this chart has the ES and its 100 dma data. Apparently a stretch of 10% above the 100 dma (1.10) has been accomplished 4 times, with 8% (1.08) usually about the max. We are currently reading around 6% (1.06) above the 100 dma.


Now what follows is a 20 year weekly chart with the VIX, ES and similar considerations using the 40 wma as a proxy for the 200 dma.


I suppose one could make the case that the VIX and ES are not as fully stretched beyond the mean on this 200 dma chart as the preceding 100 dma chart. In any event, the rubber band is looking plenty stretched and likely getting near to the point of saying 'no more'. 


Have a great week of trading!


Friday, February 17, 2012

Sold TVIX @ $17.50 pre-market


With the stock market breaking out unexpectedly to new highs yesterday I have become wary of what will come next. I sold my position in VelocityShares 2X VIX ETN (TVIX) in the pre-market this morning for $17.50. At this point I plan to just sit back and watch the incredible show until I can find an edge to re-enter TVIX again.


My TSI Trading record has been updated.


Click on the chart to ENLARGE


Wednesday, February 15, 2012

Fibonacci SPX


Last April I wrote an article titled Fibonacci Gold and to tell you the truth, I have always been very proud of that analysis and particularly so regarding the beauty and elegance of the charts. Today's post - Fibonacci SPX - will not compare with my previous inspiration, but I do think it has a relevant message that should give one something to think about. Even better if it helps my reader be prepared for investing/trading a stock market that I suspect is about to change rather dramatically.


Before we get to the Fibonacci stuff, how about we take a simple look at the SP-500 daily chart and observe the report being given from the True Strength Index (TSI) indicator. 


Click on any chart to ENLARGE


This chart goes back about a year and a half and details the major TSI sell signals in that time period. Of particular note is the trend line break SELL signal that was generated just today. Generally speaking, the most statistically favorable sell signals generated by a trend line break occur at or very near the ZERO crossover. Today the SPX daily TSI closed at +0.18 and while not entirely ideal, it is a clear warning to SELL or be very cautious with long positions, at the least.


The US Dollar Index has been rallying for days now off what appears to have become an intermediate cycle bottom. Why it has taken the stock market this many days to start falling apart, in reciprocal fashion, is a bit of a mystery to me.....but anyway, we had all kinds of news today, including a read of the FED previous meeting minutes, so perhaps that is what the market was waiting to hear. Who knows?


My point of view at this point is that the long anticipated stock market, gold and precious metals correction should be on the verge of beginning (or already has).


Now, onto Fibonacci SPX.


This chart is a weekly going back to March 2009 when the SPX bottomed at 666. The data I notated on the chart below was actually derived from a daily chart (yielding accurate measurements) then transferred to this less 'busy' weekly chart.


My research was to discover whether there is a Fibonacci time relationship between the significant peaks and valleys of the past 3 years, and if so, can we see any evidence that our current time frame possibly implicates a significant top as being ready to occur right now.


I found it challenging to present this material so that it was easily understandable. Sometimes a significant price low is followed by a significant Fibonacci measurement that targets a significant price high, and visa versa. My best solution, for now, uses a line to identify the length of the 0 - 100% time frame then identify the Fibonacci measurement (%) corresponding to the significant high or low that can be seen vertically above. 


If nothing else the interesting discovery for me was to observe how truly intertwined the movement of the S&P 500 price is to Fibonacci measurement in terms of time. Perhaps another day I can do a study of the Fibonacci relationships of price itself, as opposed to time.


Also, the very beginning of the S&P's 666 low is directly Fibonacci time related to price this week (bottom red line). Also, the March 2010 intermediate cycle low (Japan tsunami time frame) and the major intermediate cycle low this past October are correlated to price this week (purple line). And finally, the recent October high, November low and December low are in Fibonacci relationship with this week (light blue line).


As I have often mentioned, there are NO CERTAINTIES in the stock market, only probabilities. For myself, anyway, I regard today's TSI trend line break SELL signal and the Fibonacci time measurements targeting this week as favorably supporting the probability that the SPX top is in. 


Wishing you good trading!


John
tsiTrader@gmail.com


Tuesday, February 14, 2012

Bought and Sold TVIX - $17.00 / $17.50


I took an additional half position in VelocityShares 2X VIX ETN (TVIX) yesterday at $17.00 and sold that position today at $17.50. This amounted to a very modest gain of 2.9% but for a one day trade, hey, I think that's just fine. 


I made a quick chart near the time of this purchase, and another one close to the time of my sale.


My TSI Trading record has been updated.