Thursday, April 28, 2011

Using the TSI to Nail Both the BUY and the SELL

*
I wasn't going to do this, but a reader asked me if I would mind making a chart to show how I used the True Strength Index (TSI) to buy and sell my Great Panther Silver (GPL) trade. You may recall that I sold my position from my TSI Trader account yesterday.  What I did not tell you was that in another account I had doubled this position and had not sold any shares - well, not until today, that is.
*
Click on the chart to ENLARGE
*
This is a 15 minute chart of Great Panther Silver (GPL).  I bought GPL at $3.26 a couple of days ago using the TSI.  Then this morning I used the indicator to sell the other half of my double position at $3.95. 

*
Both signals were generated by a trend line break of the indicator.  The buy signal occurred just below the ZERO crossover, which is ideal.  The sell signal occurred just after a negative divergence had been made (higher high in price but lower TSI high).
*
Pretty kewl, huh?

(Shhhh.....just don't tell anyone how it works, OK? 
Let' just keep this a well-guarded secret and use it to make lots of money!)

BUY HL at $9.49 in Pre-Market

*
I just bought Hecla Mining Co (HL) in the pre-market for $9.49. Chart of HL in previous post.
*
My TSI Trading record has been updated.
*

Wednesday, April 27, 2011

Tomorrow's Trades (Today!) for Thurs. April 27, 2011

*
I have waited a month to share new trade ideas for my service Tomorrow's Trades (Today!). You can access that webpage here. There you will find exact limit order prices for the buy tomorrow and selling price when that price is reached.
*
The details of my past trade ideas and record can be examined here.
*
*
1. Entree Gold Inc (EGI)
*
Click on any chart to ENLARGE


2. Hecla Mining Co (HL)


3. New Gold Inc (NGD)

Sold GPL - $3.62 Miners and the Dollar

*
Wow, what a day! I don't know whether I should laugh or cry. 
*
Traders interpreted Ben's appearance today as suggesting there is no end in sight to the money printing machine. 
*
But tomorrow is a new day. We'll see if investor's perception holds longer than this afternoon's very emotional reaction that sent gold to new all-time highs ($1,530.70), silver to a new closing high ($47.81) and the US Dollar to new lows not seen since August of 2008 ($73.31).
*
*
Yesterday I bought Great Panther Silver (GPL) and today I sold it for $3.62.  This is the 15 minute chart I was looking at when I decided to sell.  You will see that I *anticipated* the True Strength Index (TSI) indicator to be on the verge of a break and a sell signal. And when you look at the following chart of GPL showing today's close, you will be allowed to chuckle along with me that my anticipation was probably not my finest decision.
*
Click on any chart to ENLARGE
*
Well, here is the end of day chart. It turns out that the trend line break I was *anticipating* did not happen - not even after the stock made it higher some 25 cents to $3.87. Boy, did I leave a lot of money on the table.  The TSI had it right all along and the interpreter got it wrong.
*
Anyway, I made two GPL charts to show the reader both my short-coming as a trader and how well the TSI works.
*
This is not the first time I have left a lot of money on the table, btw. It happens somewhat frequently - and those who have been reading by blog for a number of months know what I am talking about. Anyway, my attitude is to laugh, celebrate the success I do have, and look for the next trade.
*
Also, I more than doubled my position in GPL first thing this morning in another account and did not sell a single share.  So I'm doing OK. Hooray!
*
*
Some readers have inquired about the current status of the mining index.  This is a daily chart of the Market Vectors Gold Miners ETF (GDX).  The Money Flow Index (MFI) indicator has a tiny trend line break but the TSI (7,4) does not. At a -.06 reading, the ZERO crossover BUY signal is close, but not quite there yet. What can I say?  It looks good, but no BUY signal confirmed yet.
*
And finally, a daily chart of the US Dollar.  Price hovered around $74 for most of 4 days, but today that consolidation area lost it's grip. Not a good sign for the US Dollar
*
In a recent article I wrote that the speed the US Dollar crashes during the final leg of the gold and silver parabolic is about 20 - 25 cents per day.  Stated another way, the US Dollar loses $1 in value about every 4 - 5 days.  My calculation of the past 7 days is that the US Dollar has been falling at an even faster 33 cents per day average.  At this rate, the All-Time Low of the buck ($70.70) could be reached in just 8 trading sessions.
*
My TSI trading record has been updated.

Tuesday, April 26, 2011

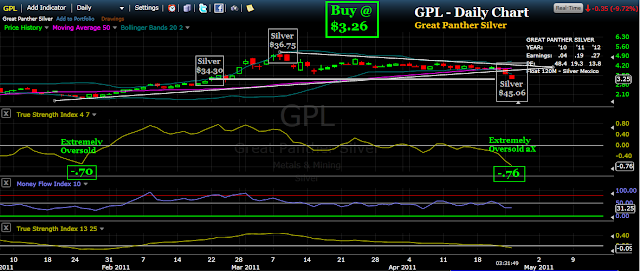
BUY GPL at $3.26

*
Well, I could not resist.  I finally broke down and bought a new mining position.  For several days I had been short the US Dollar with futures contracts, but covered them early this morning.  Flush with more cash I guess I just got back into the buying mood.
*
Click on the chart to ENLARGE
*
This is a daily chart of Great Panther Silver (GPL) which I bought for $3.26 today. If you are wondering which True Strength Index (TSI) indicator buy signal I used to make this purchase, well, I don't have a name for it.  At least not just yet, but I am open to suggestions.
*
The signal I used today is just the opposite of the one I do have a name for - the nose bleed. The nose bleed sell signal is when the TSI (7,4) reaches such a high stratospheric level that the only thing one can do is sell because that kind of momentum is impossibly unsustainable.  The TSI (7,4) is at such a high altitude that compared to all readings in the past year, it beats them all.  And, the high altitude, of course, causes a nose bleed. If you don't sell right away the profits you could have pocketed will be bled from your account. Absolutely true.
*
Before buying I did a quick check of the latest projected earnings data for GPL available at Kitco.com, and that checked out (see chart for that data). And I checked for the latest news to account for the huge sell-off, but found nothing in particular. Then I looked at the daily volume and that sold me on the stock.  The volume for yesterday and today was in excess of 7M shares - each day.  For a stock with a float just over 100M, that is a lot of selling.  My conclusion, believing that smart money sells into strength, was that this amounted to dumb money panic selling. Hey, I don't mind buying under those conditions at all.
*
Just for yucks I noted the price of silver bullion on the chart at three price points. Need I say any more?
*
My TSI Trading record has been updated.

A Game of Chess, Anyone?

*
I've been anxious to rebuy some mining positions for a couple of weeks now, but just haven't seen the setup that is right for me.  We had a buy signal many days ago on the Market Vectors Gold Miners ETF (GDX) but I could not bring myself to take it.
*
Click on any chart to ENLARGE
*
If you are interested in pondering some of the finer skills of using the True Strength Index (TSI) indicator, this post may interest you.  I'd like to show you why I did not take a perfectly good buy signal the other day and how my decision has played out so far.
*
This first chart of GDX shows where we were when the buy signal from a trend line break of the TSI first appeared on the daily chart. Not only did we get the trend line break, but the TSI was rising and clocked at -.03.  Surely another positive day would cause the TSI to rise further and generate another buy signal - the ZERO crossover!
*
But like a chess player trying to think a couple of moves ahead, I noted that the previous TSI high was +.67.  And I noted that the previous high price associated with that reading was $64.14.  Hummmm......... 
*
What would happen if GDX price were to rise a few points?  Wouldn't it make a higher price than $64.14?  Yes.  But would the TSI, then at -.03, make a higher high than +.67? NO WAY. 
*
And if the TSI did not surpass +.67 that would surely create a negative divergene and most likely bring the Tower of Babel crashing down. Heck, who wants to buy just days in front of a crashing tower?  Not me.

*
So I opted to wait.....believing the GDX would be coming back down, thus creating a much easier TSI to not only use for a trend line, but also surpass when price resumed its next rally.
*
This second daily chart of GDX brings us up to date as of this morning's early trade.  Sure enough, price did rise and nearly reach the old price high.  And sure enough, the TSI at that point was no where near the previous +.67. 
*
Price has recently fallen as I hoped, creating a new TSI high point from which to draw a new trend line. I hope that in addition to the upcoming trend line break of the TSI (7,4) we see a subtle change in direction from the slower trending magnification of the TSI (25,13).
*
Also, the last time GDX descended to its 50 dma it was supported for a few days, before falling below.  If that happens this time, honestly, that would be ideal for me.  It would push the TSI that this morning was at -.20 all the way down to -.50 or so.  And then, like holding a ball under water, the release unleashes energy that propels the ball, or in this case GDX, to defy gravity.
*
Some time ago I read that a person said, "In the stock market, there are no certainties.  Only probabilities".  And that statement struck me as very true.  There is no certainty that my chess move was the best move possible.  But I do think it has a very favorable probability. That was my move. 
*
Your turn :-)
*

Monday, April 25, 2011

Silver - Look Out Below?

*
Overnight the silver continuous futures contract (/SI) made it up to $49.82 following a sizable bullish gap opening to begin last evening's session. Since attaining this overnight high silver retreated and having found support at $47.85, is trying to make a comeback - at this writing trading around $48.05.
*
On the left side of this chart is the 60 minute look at the situation and the right side of the chart is the daily view.
*
Click on the chart to ENLARGE
*
The charts raise more questions in my mind than answers, unfortunately.  Such as, will the daily candle turn into a red reversal candle later today? Have the trend line breaks and negative divergence sell signals on the True Strength Index (TSI) correctly foretold the future? If silver does continue to retreat further will support at $46 hold?

Sunday, April 24, 2011

Gold C-wave Tops and US Dollar Crashes

*
From the inception of gold's secular bull market in 2001, gold has completed 6 ABCD wave patterns which I have graphically detailed on my website. This precious metal is now in the final process of completing its 7th C-wave which characteristically concludes with parabolic bravura.
*
Click on the chart to ENLARGE
*
I thought it would be interesting to examine the concluding weeks of the preceding 6 C-waves for some insight into how our current situation might play out, and I decided to use the vehicle of the US Dollar for this study.
*
It turns out that each and every one of gold's previous C-waves concluded simultaneously with a precipitous drop in the US Dollar Index. And as the US Dollar has recently taken out two key support levels and appears to have begun the swift crash process last week, it is not a likely coincidence that gold has moved decisively above $1500 and appears headed for $1600 in the month ahead.
*
On the 10 year chart of the US Dollar I have identified the date of each of gold's previous C-wave tops and used various colors to highlight the dollar's associated price descent.  I studied the details of each occurance and noted a 'back of the envelope' calculation regarding the speed that the US Dollar crashed.  The dollar's final decline was typically between 20 and 25 cents per day over a period of 4 - 5 weeks. Using different words, the US Dollar fell $1 every 4 - 5 days for a period of many weeks while gold soared to new heights. Every time!
*
The takeaway from this study, I suppose, is the assurance that a crash in the US Dollar is the mechanism that fuels each C-wave parabolic conclusion and the observation that the current US Dollar crash behavior has likely just gotten underway in the past few days. This implies that there are still several weeks left on the shot clock for gold and that this C-wave is no where near over.
*
Click on any chart to ENLARGE
*
A quick look at the daily chart of the U.S. Dollar Index (DXYO) with any eye on the True Strength Index (TSI) indicator for a read on current momentum shows a situation that is bearish and likely to persist for some time.
*
*
This weekly chart of the World Gold Index (XGLD) has been updated with the price performance of gold since my article Fibonacci Gold was written 3 weeks ago. At that time gold was $1429 and it appears that recent price action is headed straight for the $1600+ target with several weeks to work with.
*
Finally, a bit of housekeeping.  This spreadsheet details the current status of the service Tomorrow's Trades (Today!) that I started 2 months ago.  Each of the 20 trades was announced the evening before the buy limit order was executed, and provided the suggested limit order selling price.
*
To date 17/20 (85%) of the trades have performed as designed. The average gain per trade was 11.26% and the average holding period of each trade was 14.53 days.
*
I am assessing some new trade ideas and will make them available in the very near future.

Monday, April 18, 2011

Is It Too Late for the Miners?

*
It has been annoying these past several days to watch gold and silver break to new highs while the miners have seemingly collapsed, unable to even hold up horizontally.  So this got me to wondering - is it too late for the miners to make a big move? After doing some research my findings surprised me, and perhaps they will surprise you too.
*
I have prepared 4 charts of the Amex Gold Bugs Index (HUI).  First we will look at the huge consolidation and rallies of 2006 and 2008, then take a look at our current situation with a weekly and daily chart.
*
Click on any chart to ENLARGE
*
This is a weekly chart of HUI for the 2006 parabolic C wave conclusion. We note that the consolidation phase was 24 months, from the initial break above the consolidation line to the peak of the rally was 22 weeks, and gold appreciated from $430 to $730 during this chart's timeframe.
*
9 or 10 weeks before the final rally began the HUI reached within 8% of the consolidation support line. What followed was a relentless string of green candles to the top, taking the HUI to 49% above its consolidation support line. We also notice that the True Strength Index (TSI) did an excellent job of locating the beginning of the final rally with both a trend line break and ZERO crossover.
*
*
This is a weekly chart of the 2008 parabolic C wave conclusion.  The consolidation period was shorter than that of the 2006 specimen, and came in at 17 months. The HUI bobbed and weaved for 23 weeks after initially clearing the consolidation line before reaching its top.  During this time frame gold appreciated from $730 to $1030.
*
This time around the HUI rally lasted just 4 weeks and curiously, its began it's final launch from a price just 8% above its consolidation line.  When the top came it was 31% higher than the consolidation line.  Clearly the 2006 HUI concluding rally was longer in terms of time, more powerful in terms of % gain, and was preceded by a consolidation period longer than this 2008 example. And once again, the TSI did an admirable job in locating the bottom of the final rally.
*
*
Now we turn to our current HUI weekly chart for 2011. A couple of things are immediately obvious.  First, the consolidation period of this C wave, at 30 months, is massive by comparison to the preceding two charts.  28 weeks have already passed since the consolidation line was initially broken to the upside.
*
Gold has risen from $1030 to $1498 during this chart's timeframe.  But look at where the HUI is in relation to its consolidation line! Today's closing price action brought the HUI to within 8.5% of its enormous consolidation line. Are you thinking what I am thinking? (The previous two HUI consolidations launched from 8% also - apparently what we are seeing now is not unusual at all).
*
Ps - no buy signals on this weekly chart - yet.
*
Finally, let's take a look at the current HUI daily chart. I've marked the TSI buy and sell signals of the past few months.  Currently we are still on a sell signal..... but that just means that the buy signal comes next! Anyway, a final gain rivaling the 2008 4 week performance would take the HUI up over 100 points to around $681.  Something resembling the 2006 C wave conclusion would bring the HUI up 200 points to around $775.  And if the length of the consolidation has any relationship to the size of the final rally, the HUI should surpass $800.
*
So my question was, is it too late for the miners?  And now the answer.  No way!
*

Tuesday, April 12, 2011

Sold All Kinds of Stuff

*
As many readers know, I am a full-time public school teacher with a very thin amount of *personal reflection time* during the hours the stock market is open and trading.  During this morning's precious metal volatility I looked at the 25 or so positions I have in the three accounts I manage and said to myself, "too many positions, too complicated to keep track of with little to no time to be optimally effective - enough".
*
Gold had made a swing high signalling the likely top in its current daily cycle, the daily TSI on both gold and silver signalled a sell, and sell I did.  I sold until there was just about nothing left to sell.  I wanted to simplify my investments, move forward with clarity and that goal has been accomplished.
*
My outlook is that the US Dollar has likely not yet bottomed.  It needs to do that first, then rally to begin a new daily cycle.  Each of its most recent daily cycles have headed higher for a handful of days and then rolled over - and in the process the dollar made a lower low before the conclusion of that particular daily cycle.  I will very selectively buy positions when the dollar begins to roll over in its next daily cycle.  I anticipate that will be several to quite a few days away. And when I do buy I will keep it much simpler - no more having 25-30 positions to sell, that's for sure.
*
Today's sales in my TSI trading account included: SFMI, AGQ, GPL, SVM, NXG, SLW (options), SIL (options), and ANO. I have noted the sales prices in my TSI Trading Record.
*
My TSI Trading record has been updated and for the nine months since I began this blog the cumulative total is now 600.7%.

Sunday, April 10, 2011

The True Strength Index (TSI) and Gold/Silver Sell Signals

*
Lately I have been intently researching how well the True Strength Index (TSI) indicator works in timing a parabolic move.  This article will present 5 charts that demonstrate my findings on both daily and weekly charts of gold and silver.
*
*
First, let's begin with a weekly chart of the World Gold Index (XGLD) that encompasses the time frame of 2001 to present.  I have notated the C-wave tops and drawn in the appropriate trend line breaks of both the True Strength Index and Money Flow Index indicators.
*
Click on any chart to ENLARGE
*
The weekly TSI reading is currently .58, and by comparison to previous C-wave tops is still showing upside potential. My observation of the Money Flow Index indicator is that it either peaks at nose-bleed level at C-wave tops, or it simply stagnates sideways for a couple weeks.  Our present reading is neither nose bleed nor stagnant, so I interpret that as favorable.
*
*
Our next chart is a weekly of the World Silver Index (XSLV) covering the same time period as our first chart. Again, I have drawn the appropriate trend line breaks on both the TSI and MFI.  The current TSI reading of .76 compares favorably with the peaks of the three previous parabolic runs - all of which were close to .90.  If this parabolic turns out to be similar to the preceding specimens, the current TSI reading suggests there are between 3 and 5 weeks left on the shot clock.
*
I conclude from these two weekly charts that the TSI and MFI do a pretty good job of spotting the top and that there is excellent evidence to suggest we are not at the top yet!
*
The following 3 charts are of the gold and silver parabolic of 2004, 2006 and 2008. It was interesting for me to discover that the 2004 gold and silver parabolics topped a single day apart from one another, and that the 2006 and 2008 parabolics topped on exactly the same day. It also surprised me to see that the TSI usually gave not one but two clear sell signals before it was too late.
*
On each chart I have notated the date of each TSI signal and the number of trading days that it was either too early or too late. Also, I was curious to see how far gold and silver dropped after they peaked.  The doodling in black font on each chart is a note to myself about the percentage drop as measured from the highest price and the number of trading days to reach that particular reading.
*
*
This chart considers the 2004 gold and silver parabolic. The TSI worked really well except for the fact that gold made a double top separated by nearly 3 months.  If a person had sold gold's initial sell signals they would have captured all of the gold move but left a lot of silver's move on the table.  Fortunately, the TSI gave silver a 'get back in' buy signal in early February and a person could have done just fine following that lead.
*
*
The 2006 gold and silver parabolas are next. This time it was silver beating gold to the top and confusing things with an early sell signal.  As if to redeem itself, the TSI perfectly nailed the ultimate top of both gold and silver.
*
The 2008 TSI sell signals were excellent.  Gold and silver each reached their peak at the same time and this parabolic event was, compared to the preceding two, much more straight forward.
*
So I guess now you are wondering how it will turn out this time.  If it makes you feel any better, so am I.  I wish I knew.
*
Everyone has a hunch so I'll tell you mine.  I think silver could end up doing a remake of 2006 where it rocketed ahead to its top, getting there before gold.  Silver would then make a precipitous drop to prior support thereby letting a bunch of folks off the boat, then continue higher along with gold to its final high.
*
But who really knows, for sure?

Friday, April 8, 2011

US Dollar Breaks - LOWER

*
I have been watching this wedge on the True Strength Index (TSI) indicator developing for a couple of months now - wondering, of course, how it would turn out.  This morning I got my answer.  Not good for the US Dollar, but very good for gold and silver.
*
Click on any chart to ENLARGE
*
Meanwhile, gold is awake and responding.  The suggested trend line break on the TSI that would trigger a sell signal is no where near the current TSI reading.  It looks like this situation could take several weeks to conclude with a sell signal.

Tuesday, April 5, 2011

We Have LIFTOFF! Also, Sold GDXJ ($40.25) Buy GPL ($4.23)

*
AWESOME!  Today we finally got the huge breakout in gold and the miners that we have been waiting for.  Here comes the rest of the C wave.  Fasten your safety belts.
*
Click on the charts to ENLARGE
*
Here is a look at today's closing Amex Gold Bugs Index (HUI--X). Excellent True Strength Index indicator setups. Let the show begin!
*
I have been trying to move gold related positions over to the silver side of the ledger.  Today I got that opportunity when I was able to unload my position in Market Vectors Junior Gold Miners ETF (GDXJ) for a small gain. Honestly, the setup on GDXJ is excellent. 
*
I purchased call options on Silver Wheaton (SLW) and doubled my position in Great Panther Silver (GPL).  Meanwhile, GDXJ continued to go higher to the close and GPL lower. Short term, of course, that did not quite work out right, did it? 
*
As you can see from the chart, GPL broke the wedge on the daily chart to the downside.  With what I know of Great Panther Silver I doubt this is the future direction of the stock and I am hoping I just bought it when it was not loved.  Time will tell.
*
My TSI Trading Record has been updated.

Sunday, April 3, 2011

Fibonacci Gold

*
This article will examine the current up leg in gold price that originated in October 2008, present a study of the Fibonacci relationships of this price movement that are evident both in terms of price and time, and offer a projection of future price movement within the time frame suggested by the evidence.
*
*
We will begin with a simple weekly chart of the World Gold Index (XGLD) and employ a diagonal support trend line and three horizontal lines identifying price breakout levels.  No doubt you will notice that price movement has been subdivided into three completed stages, each separated by a new break higher through a horizontal resistance line.  And, current price is contemplating a move higher that would take it into a fourth stage of the up leg.
*
Click on any chart to ENLARGE
*
This first chart gives us a general concept of the shape, size, stages and elapsed time of this massive up leg in gold.  This will be important to keep in your mind as the following charts will add considerable visual complexity to this price history.
*
I am going to present three charts that have taken various Fibonacci measurements into consideration and identified their location on the gold price chart.  This first chart observes the Fibonacci relationships of price movement.  Measurements are taken from price movement that results in a low, a high or a breakout. The second chart observes the Fibonacci relationships of lows, highs and breakouts measured in terms of time.  The third chart attempts to consolidate and simplify the most significant details of the two preceding charts.  This chart details both Fibonacci price movement and time on a single chart and offers a possible future outcome for price movement within a specified time frame.
*
*
Each Fibonacci measurement uses the base price of $681 which was the price of gold when this up leg began in October 2008.
*
I have retained the white horizontal lines that subdivide price movement into three complete stages, though admittedly you will have to look carefully to find them.  They are identified as Level 1, Level 2 and Level 3.
*
Level 1 concluded with a bullish breakout that rallied 38.2% while Level 2 concluded with a breakout that climbed 23.6%.  Price is presently at the Level 3 horizontal resistance level and should it breakout and also rise 23.6%, gold would be taken to somewhere around the $1639 area.
*
I found it interesting that most lows (but not all) were in Fibonacci relationship with a high that followed it. Also, literally every time price reached the diagonal trend line it turned out to be a significant Fibonacci price level for either a future local high or a return to the trend line. Finally, the Level 2 and Level 3 price levels were each affirmed with a Fibonacci relationship.
*
*
This next chart considers various price landmarks and their Fibonacci relationships observed in terms of time.  Unlike the previous chart that uses the $681 price of Day 1 as the basis of all observations, this chart notes the Fibonacci time relationships that exist using many different starting points, each of which is associated with either a low, high or breakout of a resistance level.
*
My impression of this Fibonacci time data is that it may be an even stronger determinant of significant price turning points than we observed in the previous chart of Fibonacci price data. This suggests to me that gold does indeed has strong cyclical and seasonal characteristics. 
*
Nearly every significant low, high and breakout had a Fibonacci time relationship with another price landmark that followed. I was truly amazed at the intricate time relationships I found and I am sure I did not find them all.
*

*
This final chart is my attempt to synthesize the preceding charts, simplify and offer an hypothesis on future price movement. But rather than use the previous model that included significant consideration of the horizontal price levels that separate the three concluded stages, I decided to take a fresh look at price action and made some interesting discoveries. 
*
Here I have subdivided price movement into four stages which are identified using four different colored rectangular borders. Each stage has a singular similarity - that being significant price action occurring at the Fibonacci 61.8% level of the rectangle, as measured from the baseline price of $681 to the top of the rectangle. We note that the height on one rectangle become the identified break out level within the next rectangle. And, each rectangle is separated by a drop in price movement that rejoins the long term trend line before beginning the next rectangle.
*
Future price movement suggests the current rectangle will top at $1639.
*
Various Fibonacci 50% time relationships are illustrated.  If the February 2010 low is of large scale significance, it would be the 50% midpoint of gold's beginning in October 2008 and somewhere around May 23, 2011. Also, if gold should break out this week within the fourth rectangle that would correlate nicely with the breakout within the first rectangle, as the midpoint of this time frame is the beginning of the third rectangle. Finally, we are presently at the 50% mark of the time frame contemplated for the current fourth rectangle.
*
If you have comments, questions or new insights about the Fibonacci relationship of the current gold up leg and want to share them with me, just send me an email.

John Townsend
tsiTrader@gmail.com