skip to main |
skip to sidebar
*
Yesterday morning I bought DB Gold Double Short ETN (DZZ) at $8.77. At the time my indicators looked favorable and have sagged noticeably since my purchase. Anyway, I am expecting gold to enter a conclusion to this intermediate cycle (begun last July 28) during the month of December. Intermediate cycles normally conclude with a final left translated daily cycle, which we presently have, and a sharp drop in price until the daily and weekly (intermediate) cycle bottom.
*
This is a tricky trade to take and I recognize it could well backfire. Gold has been able to rally along with the US Dollar of late. I expect the dollar is not going to be able to rally much higher and so it will be a nail biter to see what gold does when the US Dollar begins to fall. I'll be on the lookout to supplement this trade with an exceptional long setup from a miner or two.
*
Click on the chart to ENLARGE
*
My TSI Trading record has been updated.
*
Today I sold Santa Fe Gold Corp (SFEG) at $1.06 for a nice 6% gain. I bought this position two weeks ago on November 8th, and from the moment of purchase until this afternoon, this stock position was under water the entire time.
*
I used my best TSI skills to time the purchase of SFEG, but instead of rewarding me the trade appeared to completely backfire.
*
Now here is the lesson I have learned well and perhaps a few readers would benefit from hearing it: this is a secular bull market for precious metals and their mining stocks. Because it is a secular bull market, price over time will continue to rise. That means when I buy a mining stock I have the expectation that if I am patient enough it will return a profit to me 98% of the time. And my record, indeed, shows that my patience, though not that of a saint, is pretty darned good. I have few losing trades because I follow this philosophy. You can, too!
*
Click on the chart to ENLARGE
*
My TSI Trading record has been updated.
*
Not entirely confident I know where things are going, I made a couple of additional sales today and my account is now over 70% in cash. This is a chart of my sale this morning of my entire position in Global X Silver Miners ETF (SIL) at $23.50.
*
Click on the charts to ENLARGE
*
I got a fortunate spike up in price from my position in Bullion Monarch Mining (BULM) and sold my position for $1.14.
*
My TSI Trading record has been updated.
*
I had a limit order in to rebuy my entire Proshares Ultra Silver 2X ETF (AGQ) position, and I'll be darned, it just got filled in the pre-market at $127.00. Maybe there is something positive about watching all these different time frames more closely.
I just resold my entire AGQ position in the pre-market for $127.00. Too much risk of US Dollar breakout to the upside at the moment for me. 9 am est
*
My TSI trading record has been updated.
*
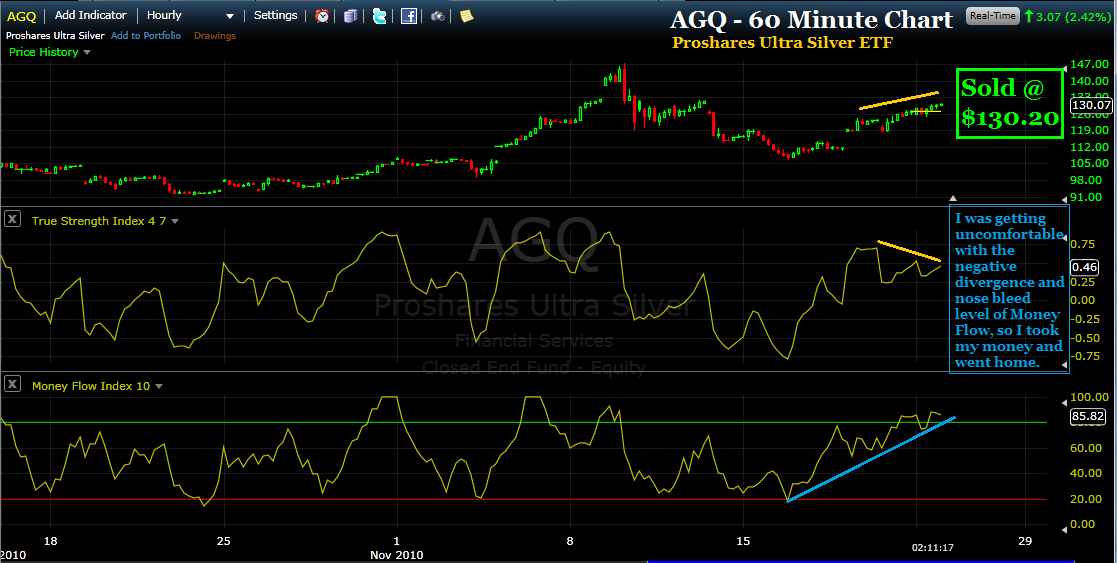
I sold my three positions in Proshares Ultra Silver ETF (AGQ) this afternoon. I am experimenting with having my FreeStockCharts screen provide me numerous tabs set to various time frames ranging from the Daily time frame sequentially down to the 15 minute time frame. I think this will be a new area for growth in my understanding of the True Strength Index (TSI) and Money Flow Index (MFI) indicators - learning to be able to discern the importance of signals given in one time frame vs. their implication in another.
*
Click on the charts to ENLARGE
*
It's going to take me a while until I get enough experience using this screen setup so that the mistakes will be fewer and farther between. For now, I just have to expect the mistakes and learn as I go. I bet you know that feeling, right?
*
So here are charts of my two sales that cleared out my entire AGQ holding. It turns out that AGQ just continued higher after my sales, so obviously my timing was less than optimal. But I am learning a new system and I forgive myself in advance for experiencing these kind of issues. One day I hope to somewhat master how all the different time frames 'speak' and then I will add another notch to my belt.
*
My TSI Trading record has been updated.
*
My cumulative record has now surpassed 500% for the past 5 months - 509.9%.
*
Also, the actual 'value' of my trading account has increased 84.78% in this time frame since beginning this blog.
*
Click on the chart to ENLARGE
*
Question: What if gold trades somewhere between $1385 and $1335 this week?
*
I don't know, what?
*
Answer: It makes a perfect pennant on the weekly chart and projects price to around $1550.
*
Huh? How do you figure that?
*
Well, pennants are mid-point consolidations that gold often uses in its parabolic C waves to divide the entire move into two equal parts. In fact, each of gold's previous 7 parabolic runs have tipped off the mid-point by some signal, such as a pennant, a bull flag, or a distinctly different slope of ascent.
*
So you just find the bottom of this rally, use the pennant as the 50% line and project the final price overhead? Sounds too easy. Can you prove this? What if you are wrong?
*
LOL, yes I will show you the previous 7 parabolics, but not tonight - I have to go to work in the morning and need to get some sleep.
*
Oh, and what if I am wrong you ask? Hummm..... well, then I'm wrong, silly. First let's just see if the pennant is completed this week and then we will take it a week at a time from there. Is that OK?
*
Sure. Why not?
*
Good night.
*
There is no other way to describe silver's price movement of the past 13 weeks other than to call it parabolic. With that in mind, I thought it would be interesting to do a little study of past silver parabolic moves and see if I could get a handle on just how high silver could travel into December before it implodes.
*
Click on the charts to ENLARGE
*
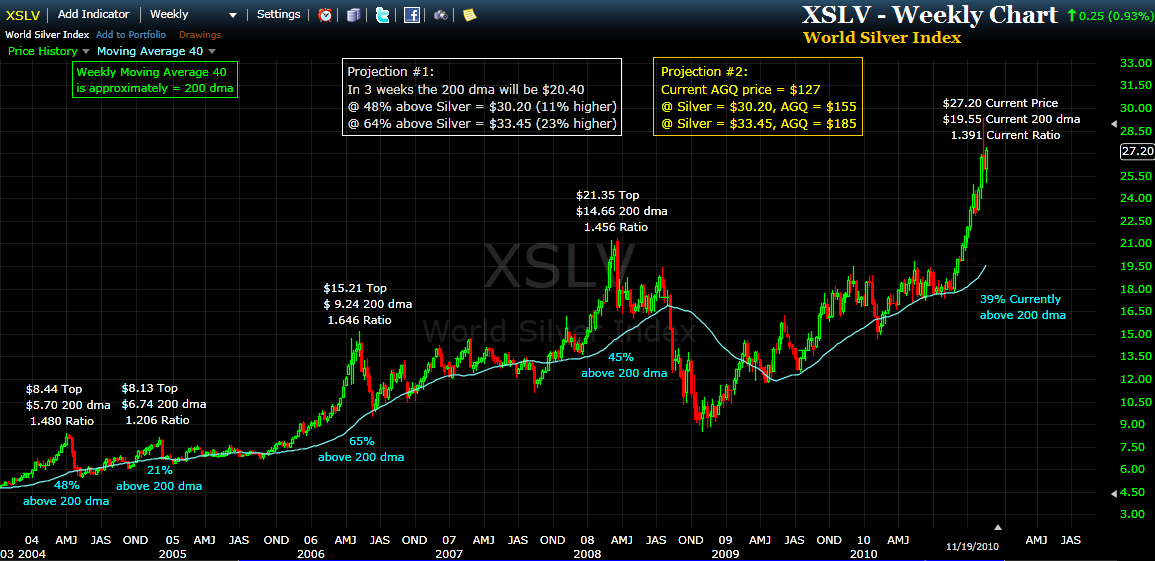
For this study I have chosen to examine the relative degree to which silver price can exceed its underlying 200 day moving average. This weekly chart of the World Silver Index (XSLV) uses the 40 week moving average as a proxy for the 200 day moving average.
*
Silver is currently making its 5th parabolic appearance since the secular bull market for gold and silver began in late 2001. The range that silver has been able to soar above its 200 dma in previous parabolic moves ranged from a modest 21% to a mind boggling 65%.
*
The rule of thumb for these kind of things is that the longer the consolidation period preceding the parabolic, the higher the concluding parabolic is likely to rocket. This understanding explains why the parabolic near the end of 2004 achieved only 21% above its 200 dma - as the consolidation period preceding it was a very brief 8 months.
*
The three other previous silver parabolics had consolidation periods of between 18-24 months. And these three were able to achieve heights exceeding the underlying 200 day moving average by 45%, 48% and 65%.
*
Our current silver parabolic has had a consolidation period utterly dwarfing all previous specimens - logging in at 33 months. It is conceivable this could be the mother of all parabolics for the current secular bull.
*
But not allowing myself to get too carried away, my chart offers a projection for silver in the range of the 3 more or less comparable predecessors. i.e. that the current parabolic will achieve a height of 48% to 65% above its 200 dma ($30.20 - $33.45). As silver closed this past week at $27.20, this range projects price higher some 11% - 23%.
*
If one is invested in Proshares Ultra 2X Silver ETF (AGQ), it is reasonable to double those projected results to amount to a forward gain of between 22% and 46%.
*
And don't forget, these calculations pretend that the consolidation period of the current parabolic is roughly identical to its predecessors. And it is not. It is nearly TWICE the size.
*
Here I offer a simple chart of Proshares Ultra 2X Silver (AGQ) with my likely modest forecast applied to the chart. I have arbitrarily chosen to guesstimate that this move will last approximately 3 weeks past today.
*
As gold appears to have begun a new 20-28 day cycle in just the past few days, it would be reasonable to assume that gold may now progress higher for approximately 3-4 weeks. The strongest seasonal price performance for gold occurs in the mid-November to mid-February time frame each year and that time window has just now been swung open. Also, in the past, the top in the daily/weekly cycle of gold has very closely lined up with the top of each silver parabolic move. So, about the time gold tops, so does silver. And unless one believes that gold has already topped, there should be plenty of time left on the shot clock for silver to complete its electrifying mission.
*
I know to many readers my thoughts may appear to be fantasy. But honestly, I don't know how to better explain what is going on with silver than the way I have.
*
The other thought I want to share is that while some of us are excited about buying this high momentum run, now is a good time to think about your plan for selling it. I really encourage each participant to think this one through before we get close to the parabolic top. It is infinitely smarter to make a decision based on premeditated rational thinking and then live its consequences, than turn into an emotional basket case and get run over by the freight train when it comes back the other direction.
*
Wishing you a highly profitable and rewarding month of December!
*
John
tsiTrader@gmail.com
*
Today I bought just one stock which was Proshares Ultra Silver (AGQ) at $123.00. My portfolio is now heavily weighted with silver and silver miners and even about 15% extended on margin. I usually do not use margin but as I believe we are beginning what will be the last bullish daily cycle of the Fall season, I will flat out go for it.
*
Silver continues to out perform Gold. I note that on the daily charts of both GLD and GDX, neither has made the ZERO crossover, and GLD has not yet even made a trend line break. Meanwhile, both SLV and SIL have made their trend line breaks official and today each made the ZERO crossover.
*
Click on the chart to ENLARGE
*
My TSI Trading record has been updated.
*
Today I bought a second stock from my wedgie collection, Gold American Mining Corp (SILA) at $0.74. As you can see from the chart it has everything going for it that I esteem - True Strength Index (TSI) and Money Flow Index (MFI) indicator trend line breaks, a significant positive divergence between price and the TSI indicator movement, and a near ZERO crossover of the TSI indicator. I have yet to take a single loss on a setup with these 4 dynamics in my favor.
*
Click on the either chart to ENLARGE
*
My TSI trading record has been updated
*
Gold and silver today performed as I hoped they would. It appears gold can make a swing low and conclude the current daily cycle with an intra day price tomorrow (Thursday) of 131.37. This would mean that a new 20-28 day daily cycle for gold would be on Day 1, and price would begin to rise.
*
In last weekend's post I asserted that buy signals were on the way for gold, silver and their miners. Well, this post is going to take a look at that assertion , show us the progress that has been made toward getting the BUY signals confirmed, and suggest the timeliness in which they may occur.
*
First, a digression for the obligatory trading record stuff. Today I made one significant purchase of Global X Silver Miners ETF (SIL) at $21.50. The chart is a 30 minute chart - both True Strength Index (TSI) and Money Flow Index (MFI) indicators have a new trend line break.
*
Click on the charts to ENLARGE
*
My TSI Trading record has been updated.
*
Not entirely following my own trading signal rules, I have been loading up on silver and silver miners for what I think is going to happen, and begin to happen soon. For those of you trader/investors more disciplined than myself, waiting for the BUY signals to be confirmed on the daily chart (here we are going to look at the 4 Hour Chart) is a very wise decision. We are not there yet, but I think another day of going nowhere will be all we need to get those BUY signs confirmed on Thursday or Friday at the latest.
*
Here, in alphabetical order, is a glimpse at the current situation for AGQ, GDX, GLD and SIL as shown on today's closing 4 Hour Charts.
*
GET READY!
*
*
I made a couple of purchases today. One had an excellent technical setup, and the other I was just playing an optimistic hunch.
*
Here is Bullion Monarch Mining Inc (BULM) which I bought because it had all the ingredients of a successful trade. True Strength Index (TSI) and Money Flow Index (MFI) trend line breaks, a positive divergence between a flat price and a rising TSI and a ZERO crossover.
*
Click on any chart to ENLARGE
*
My hunch is that Gold and Silver are getting so oversold that the current meltdown cannot continue much longer without at least a bounce. With that in mind, I bought some Global X Silver Miners ETF (SIL), not because there was a buy signal, but because I think a position now has good odds of becoming profitable relatively soon.
*
Here is a chart of $GOLD, and another of $SILVER. The RSI (3), which measures on a very short term basis how relatively oversold something is, reveals this sell-off has pushed things about as far as is likely without some kind of a bounce. Fingers crossed.
*
*
Wanna get a wedgie? No, not that kind of wedgie. I mean a stock that has formed a wedgie, like the 10 charts presented below.
*
If/when silver and gold break to the upside this week, a whole lot of these choices should break out of their wedgies and do pretty well for their owners. A wedge usually is formed because there is a battle going on between buyers and sellers. They conclude when price breaks up or down, with one side claiming victory and the other side running in defeat. A wedge can be an ideal pattern to trade, once you know which way it is going to break, that is.
*
At the present moment, both gold and silver futures are in wedges on the one hour chart. These wedges do not go on forever. At some point before they conclude, a breakout occurs.
*
With no further comment, here are 10 stocks in alphabetical order that have formed a wedge on the True Strength Index (TSI) indicator of their DAILY chart. I personally prefer those wedges that if/when broken to the upside will occur with the TSI ABOVE ZERO. Secondly, I would prefer to see that the Money Flow Index (MFI) indicator is rising.
*
I'll have my eye on these this week. Maybe you will find an interesting one to watch/trade as well.
*
Click on any chart to ENLARGE.
*
*
*
*
*
*
*
*
*
*
*
*
I'm going to go out on the limb and say that I expect to see BUY signals across the board in the precious metals sector sometime next week. And I'll show you why with charts of AGQ, GDX, GLD and SIL.
*
But first, the obligatory housekeeping for my TSI Trading record. Just one to record for Friday - a buy of Proshares Ultra Silver (AGQ) for $118.45. Honestly, I made three purchases of AGQ on Friday, but will record these trades as one at the average blended price of $118.45.
*
Click on the chart to ENLARGE
OK, now for some thoughts and analysis of the upcoming week in the precious metals space.
*
The sell off on Friday, steep, emotional and vicious as it was, did wonders for getting us ready for the next leg up. Not only did it scare the pants off the weak, it also created a beautifully crafted True Strength Index (TSI) indicator trend line above the ZERO crossover that we can use to game the next BUY signal. Something you will observe in all four charts is not only the favorable trajectory and location of the TSI trend line and how it is likely to be played out, but also the issue of unfilled open gaps on each chart, except GLD. My thought is that both of these dynamics (TSI trend line and open gaps) are going to play very favorably for the precious metal bulls next week.
*
In alphabetical ticker symbol order, let's begin with a look at Proshares Ultra Silver (AGQ). First, you will notice that a similar TSI setup that developed towards the end of October, and how it was favorably resolved with an accurate and timely BUY signal. The current setup, however, will be resolved in fewer days as the slope of the TSI trend line is noticeably steeper. Which is to say that a single day of strong price action will likely trigger a trend line break.
*
The thing one has to keep in mind, and it is not appreciated by the casual observer, is that these setups are occurring above the ZERO line. Remember, when the TSI is rising above ZERO, price is always rising. So, when the trend line break occurs, the TSI will be rising from just barely below or slightly above ZERO, triggering the bullish BUY sign of the ZERO crossover.
*
Now let's look at the Market Vectors Gold Miner ETF (GDX). Here we find an open gap and just below that an impressive layer of support. The gap may or may not get filled but I would be quite surprised if price is able to penetrate the layer of support. I think too much buying will come in to permit that - for very long, in any event. We notice the TSI is heading in a sharp trajectory downward but well above ZERO. As with AGQ, a single day of sharp buying will cause a trend line break BUY signal.
*
This next chart of the SPDR Gold Trust ETF (GLD) may provide the most interesting clue of all, and it is this: the open gap, as seen on the other three charts, is already filled. This suggests the possibility to me that this downdraft in not only GLD, but precious metals generally, may have already concluded. If not, then I would expect GLD to trade essentially sideways early next week, somewhat within the region of the gap, with the TSI drifting laterally towards the trend line drawn in red - preparing for the breakout.
*
And finally, let's have a look at the Global X Silver Miners ETF (SIL). My impression is that of the four charts, SIL has clearly been the strongest. I base this impression on the degree to which the TSI has been able to sail high above the ZERO crossover line. It would do me well to rebuy SIL when the next breakout is confirmed.
*
The same dynamics as the other charts are in place; the impossibly steep sloped TSI trend line that will be bullishly broken with a single strong day, the open gap just above a significant layer of support and a TSI that could well turn north without even crossing below ZERO.
*
With gold, silver and their miners all saying the same thing with their charts, I think when one breaks they will all break within a matter of a day or two. That would be an excellent time to load up, in my opinion.
*
My TSI Trading record has not been updated as I am having 'technical difficulties' with getting it uploaded to the website. Google keeps giving me an 'Error 400' message and I may have to redo the entire thing....perhaps break it into several smaller web pages. Darn it.
*
In my continuing quest to streamline the number of holdings in my portfolio, the break even limit order I had for Searchlight Minerals Corp (SRCH) at 69 cents was hit - taking me out of that position. The technicals actually look quite good for SRCH and should gold rally from here, it should do very well.
*
Click on the charts to ENLARGE
*
With roughly the same funds I purchased Proshares Ultra Silver (AGQ) at $130.40. At the time I made this purchase it was somewhat clear that the US Dollar was not going to immediately make a higher high.
*
However, the AGQ price movement was not particularly impressive after my purchase and into the close. This may be a position I just continue to hold as we await the outcome of the US Dollar/Gold contest currently being waged. If ultimately it appears Gold is going to break higher I will simply add to this position and initiate others. Otherwise, I am prepared to stand still and take a loss on AGQ should the US Dollar convince me it has already made its yearly cycle low.
*
My TSI Trading record has been updated.
*
Today I cleared out positions in 4 stocks in my portfolio. Now I just have 6 stock positions and am approximately 70% in cash. Today was purely a housecleaning maneuver. If I could sell something for either a gain or just break even, I sold it. No True Strength Index (TSI) or Money Flow Index (MFI) indicator considerations involved with any decision to sell. I simply wanted to clear out as much as I could w/o taking a loss.
*
The gold market is now at a precarious position, in my opinion. All due to the surprising strength and performance of the US Dollar over the past 3-4 sessions. When I wrote my article "Gold's 7 Parabolic C Waves - Projection $1,600", I did not fathom that after Ben announced a $600 BILLION effort to devalue the US Dollar, it would actually rally.
*
Duh, the only logic that seems to ring true is that, once again, when everyone is thinking the same thing, no one is thinking (starting with myself). If the US Dollar does continue the powerful rally begun 4 days ago, and take out $78.36, that will strongly suggest that the US Dollar yearly cycle low came a few weeks earlier than expected. And generally, that may/should put pressure not only on the overextended stock market, but also the precious metals and their miners. This "fact" has not occurred yet. But it could, and soon.
*
I offer these miscellaneous thoughts, of concern to me:
*
1. The CME today raised the margin requirements for silver traders by 30%. This is a clear attempt by the government to cool the speculation in silver.
*
2. The True Strength Index (TSI) indicator trend line was cracked on numerous key issues with yesterday's massive sell off. This means that any successful retest of the highs in everything from GLD, SIL, AGQ, GDXJ and so on, will create negative divergences across the board. Little old me, for one, will take that opportunity to short - probably using ZSL.
*
3. Call me cynical, but following the massive distribution day of yesterday - where volume was astronomic and price could not rise (it dropped) - what better follow up for today and potentially the next couple days (Thursday and Friday) than to allow gold related securities price to be somewhat positive for most of the day - as smart money continues to sell to the dummies who are 'buying the dip'.
*
Well, the US Dollar yearly cycle low is, as yet, unsubstantiated. Ditto for my cynical comments. But these were my trades for today, nevertheless:
*
*
This is Timberline Resources Corp (TLR) which I sold at breakeven $1.18. TLR did close today's session at $1.23.
Click on any chart to ENLARGE
*
This second sale was of Gold Reserve Inc (GRZ) at $1.55. This was a 4.0% gain for me and GRZ closed this session at $1.50.
*
The third sale today was of Silver Dragon Resources (SDRG) at $0.23 for a modest 4.5% gain. SDRG closed today at $0.26.
*
My final housekeeping clean-up sale was of Continental Minerals (KMKCF) at breakeven $2.54. KMKCF closed today's session at $2.54.
*
My TSI Trading record has been updated and my cumulative record, begun a little less that 5 months ago is now at 495.6%.
*
Wow - what a crazy day again today. And to think our situation is going to just get better is mind blowing.
*
Anyway, I made three sales today and three purchases. This first chart is my sale of the Global X Silver Miner ETF (SIL) at $22.87. I was looking for a pullback, based on the TSI, but I was hours early. It is presently occurring in the after hours market this evening.
*
It really bothers me that I cannot have the opportunity to time these sales and purchases to my satisfaction - due to my full time job - but as long as I keep taking profits and not losses I should do OK in the end.
*
This sale was of the red hot Proshares Ultra Silver ETF (AGQ) for $129.85. This too is finally pulling back in the after hours so I most definitely did not trade out at the top.
*
Finally, I sold Paramount Gold Mining Corp (PZG) for $1.86. I purchased it just last Thursday and think I timed the sale pretty well - earning a modest 6.5% gain.
*
Late in the afternoon I figured I had taken too much money off the table and needed to do some buying so I acquired shares of Silver Dragon Resources (SDRG) at 22 cents as it looked to have a strong technical setup.
*
I also re-bought Timberline Resources Corp (TLR) at $1.18. Excellent set up.
*
And I re-bought shares of Santa Fe Gold Corp (SFEG) at $1.00. The setup is not quite there, but pretty close.
*
This is going to be an exciting month. Fasten your seat belts... you will need it!
*
My TSI Trading record has been updated.


![[Most Recent Quotes from www.kitco.com]](http://www.kitconet.com/images/quotes_special.gif)


