Sunday, October 31, 2010

Fools, Damn Fools

*
One of the worst places for an investor to ever be is where everyone else is.  Why?  Because when someone yells "fire", or in the case of elephants yells "lion", the herd turns abruptly and you, being in the middle of the pack, get trampled.
*
One of the ways we can see where the herd is standing is to look at stuff like the put to call volume ratio of a security, or its short interest - that is the degree to which its shares are sold short.  If you find yourself standing where an accumulation of that crowd is standing, run - before it is too late.
*
So where are elephants standing with respect to the stock market right now?  This chart of the put to call volume ratio of Direxion 3X Small Cap Bull ETF (TNA) gives us an incredible insight.
*
Click on the charts to ENLARGE
*


*
OK, so where are the elephants hiding with respect to the miners, say, the Market Vector ETF (GDX)?  
*
Well, it looks like I see them over there, shorting the GDX ETF like the miners are about to roll over and die.  Now that's about as likely as Ben announcing he has changed his mind about doing QE2.
*
And there are more elephants there than ever before.  Tisk, tisk, tisk.
*
OK, maybe the crowd had the good sense to stay away from a truly great company with what most will acknowledge has a bullet proof business model - Silver Wheaton (SLW). 
*
A look at the chart tells that story.
*
Nope, more elephants than you can shake a stick at and most within 2 inches of each other.  Tisk, tisk, tisk - again.
*
When you the TV commentators talk about a "crowded traded", this is what it looks like.
*
Oh well, I guess we need these folks to make a market for the rest of us, right?  :-)


Saturday, October 30, 2010

The Big Picture for Gold and Silver - November 2010

*
*
This first daily chart examines the gold secular bull market beginning in late 2001, with emphasis on the relationship between C wave tops and the underlying 200 day moving average, and provides some guesstimates for just how high gold will fly in the months ahead.  In brief, I am thinking that gold could reach as high as $1,600 in the next 5 weeks and $2,000+ before this C wave has concluded next late Spring.
*
I am indebted to Toby Connor of Gold Scents and Gary Savage for much of my analysis.
*
There are various techniques for guesstimating the height which the parabolic C wave of gold's repetitive ABCD wave pattern will rise.  One of the standard approaches is illustrated here and is simply the percentage price is able to rise above the 200 day moving average, before plummeting back towards earth.  
*
A couple of things about the ABCD pattern.  Notice how each successive pattern has become generally larger, longer and more capable of propelling price higher above the 200 dma.  And, of course, notice that each C wave concludes with a parabolic advance.
*
(For a detailed look at gold's repetitive ABCD pattern, examine the chart here).
*
It is thought that the current C wave will transpire over 3 stages or phases.  
*
Phase 1 concluded this past December 2009 at the time of the US Dollar yearly cycle low and at a price of $1227 - 25.3% above the 200 dma.
*
Phase 2 of the current C wave appears to be entering its final right translated daily cycle which could propel gold price to $1600 - some 30% above the 200 dma.  At the time of this writing, gold is only 10% above the 200 dma, so we are talking about quite a move and quickly throughout the month of November.
*
Phase 3 is thought to coincide with the major 3 year cycle low of the US Dollar expected in the late spring of 2011.  A rise above the 200 dma of approximately 50% would be a truly parabolic climax to this, the largest and most massive C wave to date - and yield a top somewhere around $2,000+.
  
*
Silver is likely to strongly outperform gold.  It does not trade in the repetitive ABCD pattern as does gold.  However, it absolutely has its own parabolic advances that can be measured in terms of their height above the 200 dma.  Another metric often used to guesstimate the height of a silver parabolic is the historical ratio of the price of gold to silver at previous parabolics.   Without going into those details at this time, that ratio is still far away from what is possible if not likely for our current silver advance.
*
Silver is currently 32% above its 200 dma.  If we assign a percentage consistent with previous parabolics, say 60%, silver could easily reach $32 by the end of November.  Silver closed last Friday just below $25.
*
INVESTMENT STRATEGY:  I have done well using the TSI to trade short term surges in the momentum of mining stocks.  However, I do not anticipate this strategy to be particularly advantageous during a parabolic rise in gold and silver.  Rather, a buy and hold strategy would probably work the best and once I have my portfolio set I will resist 'overtrading' for the next several weeks.  
*
Some ETFs that I will now consider purchasing:  SIL, AGQ, GDXJ.  Their charts are presented individually below.
*

Sold AGQ, SFMI, FOLGF, CLHRF - Bought TZA

*
I was in profit taking and defensive mode on Friday, for better or worse.  This first chart is my sale of Proshares Ultra Silver (AGQ) in the early minutes of the pre-market.  At that time I was uneasy as to the direction things would turn out for the day and so I took my gain and left the table.  Of course, we all now know that the day turned out to be extremely bullish for gold and silver.  I will be back soon to reload AGQ!
*
Click on any chart to ENLARGE
*
I had a fairly large position in Silver Falcon Mining (SFMI) and decided to take the easy money off the table (15.7% gain) from my most recent purchase at $0.14.  I do still own 2 purchases from the 17 cent and 18 cent levels.  The technical setup for SFMI looks excellent.


*
I was not amused with the information I uncovered from a further look at Falcon Oil & Gas Ltd (FOLGF) and was just fine about selling my entire position at break even.


*
My final sale was for a fast 7.1% gain on Coral Gold Resources (CLHRF).  As Friday began I had 14 stocks in my portfolio and frankly, I felt like I was tripping over them every time I turned.  Now I am down to 10 stocks and I will probably try to reduce that number further this week.  The technical setup for CLHRF now appears absolutely ideal (I hate to admit...as I have sold it).
*
Feeling defensive about a market correction and noticing some strong bullish technical underpinnings to Direxion Small Cap Bear 3X (TZA) ETF, I took a small position at $22.46.  I envision this as a trade in which I have used the TSI and MFI to get me in, and I intend to use those indicators to tell me when to sell - almost certainly before Wednesday afternoon when the FED releases it QE2 plan.
*
My TSI Trading record has been updated and my cumulative trading record since beginning this blog on last June 11 now exceeds 400%.


Wednesday, October 27, 2010

Geez, There's Always Another Possibility, You Know?

*
Today we came within an eyelash of taking out the price level I identified as the swing high for the US Dollar and the basis on which I proclaimed the top of the US Dollar's current daily cycle - further defining this occurrence as EXTREMELY BEARISH.
*
And, today we also came within an eyelash of taking out the price level I identified as the swing low for Gold which I used to proclaim as the beginning of a bullish new daily cycle for Gold.
*
Wow, those were close calls.
*
This evening I got to looking at the chart of Gold and well, I got to wondering about something.  I wondered how often the True Strength Index (TSI) indicator called the daily cycle lows for gold in the past.  And, I wondered how well the Money Flow Index (MFI) indicator called the daily cycle lows for gold in the past.
*
So I made this chart and, heck, this is getting interesting.  It turns out that the TSI did an incredibly great job of calling nearly every single daily cycle low to the day for the past year.  
*
Just as amazing to me......so did the Money Flow Index (10).
*
Take a look at the chart and you will see I have identified the date of the daily cycle bottoms just under price, and the date of the TSI and MFI indicators just under their bottoming spike.
*
So what is this 'another possibility', you ask?  Well, I wonder if the price of gold is going to trade just a tad LOWER than what I think is the daily cycle low price of $1315, thus creating a positive divergence with the TSI indicator as it has done three times in the past year, THEN gold is going to take off.
*
Also, check out the current reading of the MFI (10).  At 20.19, that sure looks like a bottom to me....or darned close.
*
And a third observation.  Price is only 10% above the 200 dma.  Even the little run up we had last December made it to +25.3%.  Surely this is not the top for gold.  No way.  C waves do NOT end with a whimper - EVER.  There is more upside to come!
*
Maybe you see something on this chart that I have missed or worse yet, misinterpreted.  Please let me know, for goodness sakes!  tsiTrader@gmail.com
*


Tuesday, October 26, 2010

Recent US Dollar and Gold Daily Cycles

*
I thought some may find it interesting to visually see the previous four daily cycles of both the US Dollar and Gold, and so I made this chart.  You will notice that the daily cycles of the US Dollar and Gold are usually both between 20 - 28 days and that they closely, but not perfectly, align with each other.
*
I have placed a little green star above each day that represented the top of a daily cycle. Normally, this top will either be left or right of center.  For example, a daily cycle that measures 24 days would be considered left translated if it topped on day 7 and right translated if it topped on day 16.
*
Bearish weekly cycles are made up of several of these smaller daily cycles which, themselves,  top to the left of center.  
*
Bullish weekly cycles are made up of several of these smaller daily cycles which, themselves,  top to the right of center.  
*
As one would guess, a bearish weekly cycle tops left of the center point of its cycle.  And, a bullish weekly cycle will top right of the center point of its cycle.
*
The new US Dollar weekly cycle, which will likely consist of 4 daily cycles and last approximately 20 weeks, topped in a mere 12 days.  This is EXTREMELY left translated and EXTREMELY bearish.  Notice how each US Dollar daily cycle has also been extremely left translated.
*
The first two daily cycles of gold's new weekly cycle have been EXTREMELY right translated and that is EXTREMELY bullish.  Incidentally, the Gold weekly cycle, like the US Dollar, is also about 20 weeks long.
*
We have now begun the third daily cycle for both the US Dollar and Gold within the new current weekly cycle identified on the chart.
*
The US Dollar has already topped out in 3 days - which is extremely left translated and very bearish.  Meanwhile, Gold is just getting started with three up days in a row.
*
My best guess is that the current daily cycle for Gold will not only be bullishly right translated, but it will likely be semi-parabolic in contrast to the US Dollar which has already peaked and will be falling for most of the rest of this daily cycle.
*
Click on the chart to ENLARGE

Monday, October 25, 2010

7 BUYS - AGQ, CDY, CLHRF, CXZ, PLG, RCTFF, and SFMI

*
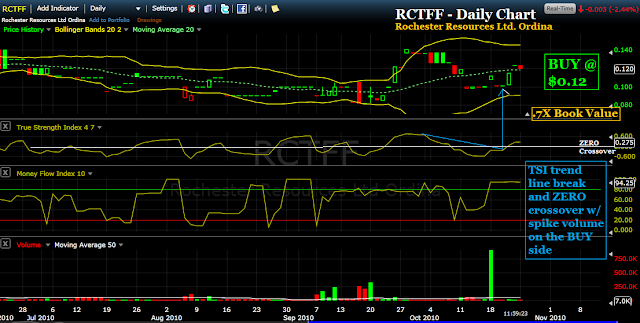
I did quite a bit of buying today as it was Day 1 of a new daily cycle for gold.  The stocks I bought today had excellent True Strength Index (TSI) indicator setups and a common theme of extreme value.  I think 4 of my 7 purchases are securities selling at or BELOW book value.  In the past I have made my biggest gains buying stocks exhibiting great technical setups along with offering extraordinary value.  I see no reason to change that strategy any time soon.
*
Rather than dialog about each stocks setup and fundamental value, which I have clearly articulated on each chart, I will simply present the 7 charts.  
*
If you have any interest or question about these 7, please feel free to drop me a line at tsiTrader@gmail.com

*
1.  Proshares Ultra Silver (AGQ) Click on any chart to ENLARGE

2. Cardero Resource Corp (CDY)


3. Coral Gold Resources (CLHRF)


*
4.  Crosshair Exploration (CXZ)


*
5.  Platinum Group Metal (PLG


*
6.  Rochester Resources Ltd Ordina (RCTFF)


*
7.  Silver Falcon Mining (SFMI)

My TSI Trading Record has been updated.

Sunday, October 24, 2010

True Strength Index (TSI) Indicator Trading Tips and Tricks

*
It's been a while since I last put the basic trading tips and tricks of using the True Strength Index (TSI) indicator in a single post.  So with the upcoming upleg in gold and miners just ahead, this should be a good time to review how the indicator works so that you, the reader, can join me in making profitable use of it.
*
I will offer three separate techniques for deriving BUY/SELL signals using the TSI indicator, but first let's begin with a basic understanding of how the indicator works.
*
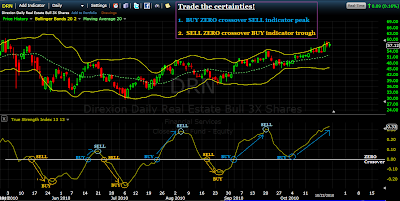
This first chart attempts to illustrate the 4 conditions in which the TSI indicator is interpreted differently.  The TSI line oscillates above and below a ZERO line yielding positive and negative readings over time.  The 4 conditions are illustrated in different colors on this chart - 1 for each possible condition.
*
Those conditions are:
1.  TSI rising above ZERO - 100% certainty price is rising
2.  TSI falling below ZERO - 100% certainty price is falling
3.  TSI falling *above* ZERO - price may be falling or consolidating sideways
4.  TSI rising *below* ZERO - price may be rising or consolidating sideways
*
Trading Tip #1, of course, would be to trade the certainties.  
*
That is, buy when the indicator crosses up though ZERO and hold as long as the indicator continues to rise above ZERO.  AND,  sell when the indicator falls down through ZERO and hold short as long as the indicator continues to fall below ZERO.
*
Honestly, you will find it difficult to find a more fool proof strategy than this one.  
*
Trading Tip #2 is to trade the trend line breaks of the indicator. 
*
All that is required to use this tip is the ability to draw straight lines and an eye for where to draw them.  I practice drawing trend line breaks every day and you will find that it is pretty easy to get the hang of, especially with practice.
*
In fact, using FreeStockCharts to make these charts, I simply have trend lines drawn on the 150 mining stocks I follow and I wait, like a cat at the mouse hole, for the indicator to break a pre-drawn trend line.  I pop through my 150 charts looking for a fish on the hook (broken trend line) and then pull the trigger - either to BUY or to SELL.  Trust me, it works pretty well.  :-)
*
Now if that is a tad too much work for you, Trading Tip #3 might be to your liking.  
*
What you can do is simply add a fairly fast moving average, say (5), to the TSI indicator.  When the indicator crosses up through the moving average, you BUY.  When the indicator crosses down through the moving average, you SELL.  Just make the color of the two lines different so you can visually keep them straight!
*
I don't personally use this moving average technique as I prefer to get a little faster signal from the trend line break trick, but if you are simply trying to trade longer swings and get most of the meat off the bone, with little effort, this is a great technique.
*
Now you may have noticed that in these examples I used a TSI setting of (13,13).  This too, I do not use in real life.  I always use (7,4).  I used (13,13) in this post to make the lines smoother and the concepts easier to communicate and visualize.  
*
My preference for the (7,4) setting is that it is faster to give me the signals and, with training I have learned how to mentally filter out a lot of the whipsaws that you will not see using (13,13).
*
I also always accompany the TSI (7,4) with a second indicator, Money Flow Index (10).  I use basically the same techniques and tricks on the MFI indicator as the TSI indicator and it usually give me a validation of my TSI interpretation.
*
Hey, thanks for reading this far and I wish you very profitable trading using the True Strength Index (TSI) indicator.  If I can further your understanding in any way, please do not hesitate to shoot me an email with your questions or thoughts.  tsiTrader@gmail.com

BOUGHT KXM $0.985

*
I had a single trade last Friday with this purchase of Kobex Minerals Inc. (KXM) at $0.985.  Technically it has a ZERO crossover and a positive divergence in place.  What additionally intrigued me was to learn that the stock trades at 1.1X Book Value and has 90 cents per share in CASH.
*
I am planning on being an aggressive buyer of miners this week provided the US Dollar shows signs of continuing to weaken.  If the Dollar does weaken I think it likely the bottom in gold was put in last Friday and we should be done with the gold correction.  
*
I have limit orders placed for quite a few stocks, which include:  RMLFF, GSTP, ELRFF, CXZ, BCEKF, CLHRF, PLG, CDY, SFMI and RCTFF.
*
In most cases these stocks are currently exhibiting a TSI trend line break or a bullish zero crossover of the True Strength Index (TSI) indicator.
*
Click on the chart to ENLARGE
*
My TSI trading record has been updated.

Thursday, October 21, 2010

SOLD DTO $65.56 SFMI $0.142 BOUGHT FOLGF $0.13 and RCTFF $.112

*
In the spirit of trying to stand aside from the current US Dollar unpredictability, I sold PowerShares DB Crude Oil Double Short ETN (DTO) on the open at $65.56.  The loss I incurred on this trade was barely 1/2%.  The ETN was up a little more than 4% today and is sporting a TSI BUY signal as well as a bullish ZERO crossover.  
*
Click on the charts to ENLARGE
*
My other sale after the market opened today was a partial liquidation of my shares for $0.142 of Silver Falcoln Mining (SFMI).  I have debited the sale of these shares against the purchase I made two days ago at $0.125 and recorded a gain of 13.6%.
*
SFMI appears to be just beginning a TSI BUY signal and though deeply below ZERO, I just may try to get some more shares if they can be purchased at a lower price.
*
I bought shares of Falcoln Oil & Gas Ltd (FOLGF) at 13 cents.  What I found intriguing about this setup is the knowledge that the stock is selling at .3X Book Value.  The other thing from the technical side of things is the "stealth" setup noted - where TSI is rising towards the ZERO crossover and price remains flat (positive divergence).  Usually this will lead to an upside breakout of price.
*
I also bought some shares of Rochester Resources Ltd Ordina (RTCFF) at $0.112.  After looking at over a hundred mining stocks this afternoon this is one of the few that had the TSI trend line break with a ZERO crossover and a positive divergence in place.  RTCFF currently sells at .6X Book Value and has zero debt.
*
My TSI Trading record has been updated.


SOLD TZA $22.30 and FAZ $12.20

*
I am no longer confident the US Dollar is going to be able to mount more than the brief 2 day counter rally we had earlier in the week.  Absolutely pathetic non-strength from the Dollar!
*
Call me cynical, but I cannot help but think Ben is printing money like mad to keep the stock market and all asset classes afloat another 2 weeks to get past the November 2nd elections.  The stock market should be correcting as the 40 day daily cycle has now run to day 38ish with no discernible top clearly in place.  
*
On another post I will show you the parallel between the current situation and the mini-crash of last April/May 2010.   I now think a mini-crash is not only likely, but also just a couple weeks away.
*
When the market opens in a couple hours I will sell my short oil position (DTO) and then be free of all positions expecting a US Dollar counter rally.  I have already sold TZA and FAZ in the pre-market.  Also, the EURO has successfully penetrated the overhead resistance level at 1.40 and been holding for the past 5 hours.  This bodes ill for the US Dollar.
*
This first daily chart is of Direxion Small Cap Bear 3X (TZA) which I sold in the pre-market for $22.30.  The True Strength Index (TSI) indicator BUY signal of a couple days ago was valid and did indeed precisely nail the beginning of the US Dollar rally/stock market correction.  However, as the indicator reading is below ZERO, any downward movement of the indicator means that price is moving lower.  And, that is the situation as it exists at this moment.  Had the TSI been above ZERO at this time, any downward movement would have had an entirely different implication.
*
Click on the charts to ENLARGE
*
This second daily chart is my sale of Direxion Financial Bear 3X Shares (FAZ) at $12.20 in this morning's pre-market.  Again, the TSI gave a very timely and accurate BUY signal.  We even had some follow through that included the bullish ZERO line crossover of the indicator reading. But now we see that the indicator has fallen below ZERO yielding a SELL signal.
*
My TSI Trading record has been updated.

Tuesday, October 19, 2010

SOLD ZSL $17.90 BOUGHT FAZ $13.11 DTO $65.93 SFMI $0.125

*
I have been extremely pressed for time of late to get everything done I'd like to get done.  I made three trades yesterday and am just now getting around to posting them.
*
With no regret, but unfortunately, I sold my ZSL position before it would have made some nice money.  I say no regret because I absolutely understand I will never be able to be 100% accurate.  I say unfortunately because I was in the right place at the right time and just did not stay there long enough.
*
This is Proshares Ultrashort Silver (ZSL) which I sold for a minuscule profit at $17.90.
*
Great setup and I let the big fish get away.  Doesn't happen often, so I'll sure to tell my Grandkids (when I have any, that is).  ZSL close today somewhere around $19.
*
This is yesterday's purchase of Direxion Financial Bear 3X Shares (FAZ) at $13.11.  I was about a day early on this purchase but it's going to work out just fine.
*
This is yesterday's purchase of Proshares DB Crude Oil Short ETN (DTO) at $65.93.  Again, I was about a day early on buying this, but who cares?  It's going to work out great, just the same.


*
This is the only trade I made today - a purchase of Silver Falcoln Mining (SFMI) at $0.125.  I know this stock well and usually when it trades below the lower Bollinger Band it will pop back up.  May happen this time.  May not happen this time.  It does seem to be at longer term support so I cannot imagine it is going much lower, if at all.  
*
My TSI Trading record has been updated.

Saturday, October 16, 2010

True Strength Index (TSI) Breakouts - ETFs

*
As I am guessing my favorite sector to trade - the precious metal miners - may be taking a short breather for a couple of weeks, I thought it would be interesting to see what else there is to trade that is currently exhibiting a truly first class technical setup.
*
For my most ideal setup, 4 conditions are present.  It is rare to find all four of these conditions coexisting at the same time and usually it is enough that only 2 conditions are active.  But sometimes it does happen that 3 or even 4 conditions are active and then it is next to impossible to have a losing trade.
*
The four ideal conditions are as follows:
1.  Breakout of the True Strength Index (TSI) indicator trend line
2.  Breakout of the Money Flow Index (MFI) indicator trend line
3.  TSI indicator crossover of the ZERO line (from negative readings to positive)
4.  Positive divergence of the TSI indicator with respect to price movement (indicator rising, price falling)
*
I always set my TSI indicator to (7,4).  I always set my MFI indicator to (10).  I always use the software freely available at FreeStockCharts.com for my analysis.
*
For today's musing I have revisited my arsenal of double and triple strength ETFs, and found a handful of candidates that I personally will consider buying after this weekend.  These ETFs, in alphabetical order include:  DEE, DNO, DTO, and FAZ.
*
So let's get to these 4 charts now, and see which ones look most promising!
*
The first ETF will be DB Commodity Double Short ETN (DEE).   I guess it would make sense that as most commodities, such as gold, silver, ag, and oil have been very hot for the past couple of months, they may take a breather with the upcoming market correction - and money can now be made shorting their correction.
*
Second is the United States Short Oil Fund (DNO).  This ETF is NOT leveraged.  What an incredible setup this one has!  This is about as good as it ever gets.  


*
Third is PowerShares DB Crude Oil Double Short ETN (DTO).  This is a 2X leveraged short ETN and save for the ZERO crossover, which is a scant distance away, this is a perfect setup.


*
Fourth and finally will be Direxion Financial Bear 3X Shares (FAZ).  Flawless setup - somebody will make money this week owning FAZ.
*
Not sure you want to trade a 3x leveraged ETF?  Maybe consider SKF, which is a 2X short Financial ETF.  Trust me, the setup is identical - I checked.
*
I found a couple other ETF themes that also checked out very favorably.  They were Direxion  Daily India Bear 2X (INDZ) and Direxion Daily Retail Bear 2X (RETS).   I did not include them in this post because they trade with quite thin volume and knowing that most of my readers are heavy hitters, well, that would just not be acceptable, would it?
*
A recap for this post would be to anticipate weakness this upcoming week in key areas that generally hold the stock market up.  Those themes include commodities, oil, financials and retail.  And a reminder that one can make money when the market goes up.  And one can make just as money when the market goes down.