The HUI Gold Bugs Index is comprised of 16 large gold mining companies. They have been taking a beating for quite a while and I have been waiting to see a particular technical setup to identify to ideal location for a final bottom. Thursday's close provided that setup and I would like to show it to you in this post.
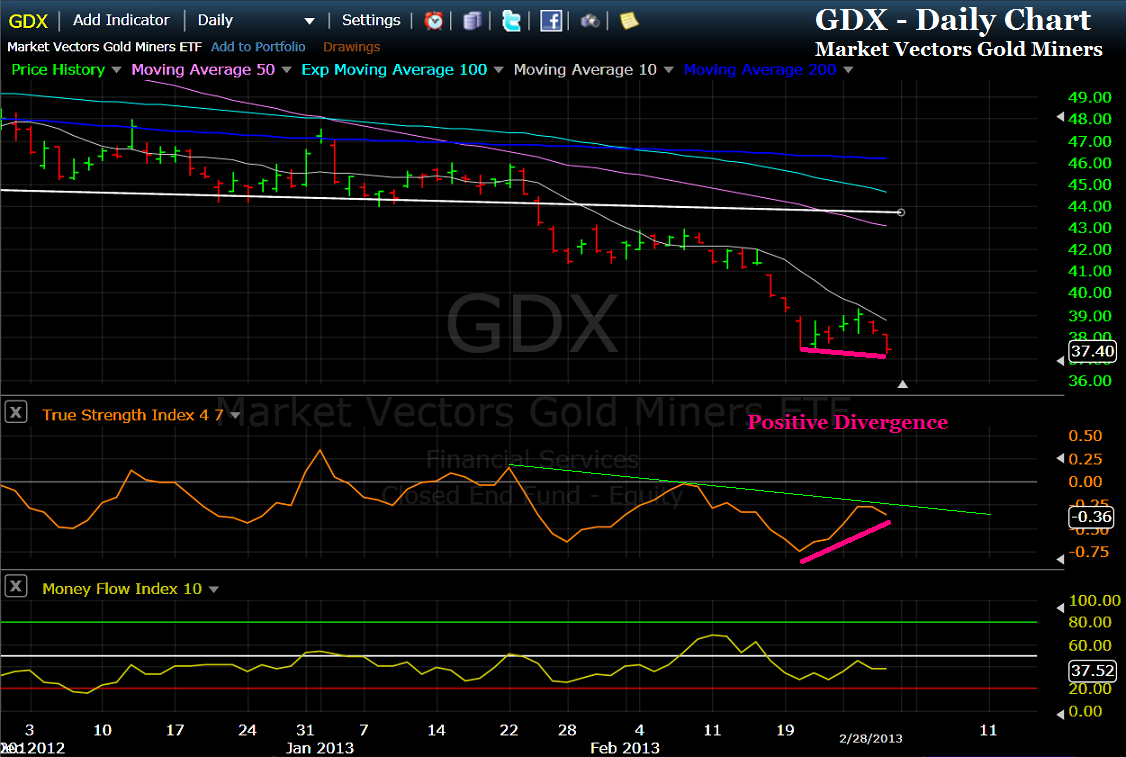
What follows are daily charts of 8 HUI miners and the Market Vectors Gold Miners ETF (GDX) that are simultaneously providing a positive divergence BUY signal. A number of the remaining 8 HUI Gold Bugs members are literally inches from yielding the same signal.
Also, I have identified the trend line break BUY signal location for each with a green line. When price reverses direction upward it will trigger a confirming round of BUY signals.
The fuse is lit. One good reversal of sentiment should set off a chain reaction that will bring a smile to my face - and maybe also yours.
Cover you ears.


![[Most Recent Quotes from www.kitco.com]](http://www.kitconet.com/images/quotes_special.gif)


John,
ReplyDeleteHUI seems to be breaking down.. maybe it is signalling a market crash as it did in 2008... this seems to be a slow bleed followed by the death gush.
Anon - no offense intended, but your thoughts are tough
ReplyDeletefor me to believe.
Today NGD broke out of its Positive Divergence TSI (7,4)
BUY signal, gave an additional Trend Line Break BUY signal
and romped upwards 5.11%. Meanwhile, two new HUI miners
gave a Positive Divergence BUY signals - Gold Fields Ltd. and
Randgold Resources Ltd., bringing the current total up to 9/16
with a positive divergence BUY signal. GDX HUI also retained its
bullish BUY signal today.
Heck, gold futures (GC) came within just $6 of giving a
positive divergence BUY signal that would have been outrageously
humorous to see. The previous TSI low reading was -90 with gold's
low coming in at $1558.1. Today low price was $1564 and the TSI
closed at 24 and change. Gold is now so close making a trend line
break with a ZERO crossover that it is just begging for the show
to begin.
The HUI setup is like looking at a Medieval battle field with nearly
every catapult loaded and ready to launch. Somebody is going to give
the signal to cut the ropes holding back the ammunition and then
we should offer a prayer for the shorts too greedy to get out of the
line of fire.
John,
ReplyDeleteLove your blog, love your commentary. However, it looks like HUI does have a few more weeks (maybe 2ish) downward momentum. If someone is not using leverage it's not a problem, but I do like NUGT - so I am waiting for a reversal. Blees can stay at 100 for a few weeks. I'm not trying to be contrarian, just my observations. I'll post a chart when I get home.
All the best. Can't wait for upward momentum to return,
Alex
John,
ReplyDeleteHere is a long term perspective:
Monthly: http://screencast.com/t/ak2a9nRuaFl
Azi's chart for the monthly: http://screencast.com/t/Dm8j50QX3 (really thought this one would hold, but that's what stops are for).
The bullish percent is quite washed out, which is great, but we could still get one more flush down. Once I see the long tailed candles I'll get in.
All the best,
Alex
John,
ReplyDeleteThese charts sure do look good! And I added my Nugt position on Friday. BUT......
Alex - I was not able to recreate Azi's chart (monthly HUI) - did not seem to
ReplyDeletematter whether I used log scaling or not. Connecting `01 June and November with
`08 lows created a trend line vastly different than Azi's.
Bullish percent - I am decided - is a waste of time as a trading tool. Yes, it gives
one some general sense of whether sentiment has swung to an extreme and the direction
of the trend. But it's 'signal' is invariably late. Sometimes, really late.
Study `08, for example. HUI spent 3 days bouncing off $150 at it's absolute low. 5 weeks
later the $BPGDM bottomed with a reading of 0 for 3 days. *5 weeks later*. At that point
HUI was already trading around $225. This amounted to a $75 gain on a base price of $150.
In other words, HUI was already 50% HIGHER than it lows *when $BPGDM read 0*. Off by 5 weeks
and by a 50% price move does not impress me.
For a while I wasn't sure what could possibly explain this observation, but it didn't help
that I had never used P&F charting much before. Then I figured out the explanation.
Using the P&F charting method, a stock will receive a slew of X or 0 in one direction as
price trends strongly. Once the price trend reaches the extreme (bottom or top) and begins
to reverse trend direction the P&F charting method does not immediately recognize this.
For some time it will continue to claim that it's signal has not changed. That is because
the system needs to see a number of boxes filled in the reversed direction before it makes
a new signal - in our case, a bullish signal.
What happens is that a whole slew of HUI component stocks bottom and begin to rise. Simultaneously,
a few of the holdout component stocks finally fall just enough to lose their 'bullish' recognition.
At that point the $BPGDM score the % on a bullish signal at 0. But the truth is that the
majority of stocks have long since bottomed but have not yet collectively triggered a
single 'bullish' P&F metric. In `08, this is precisely what seemed to have happened. That is, the
HUI rallied considerably while the $BPGDM continued lower towards 0 for a matter of many weeks.
USD is breaking out to the upside. I am not convinced that the bottom in gold has arrived. There may be still more pains to come...say a few more weeks.
ReplyDeleteI see this article was written pre-market, Friday, John. Were you able to take away additional observation's from Friday's session?
ReplyDeleteObviously the pendulum has swung against metals and miners. Can you tell me where we are in the A-B-C-D pattern you have written about previously?
If you have a thesis, I wonder where you see the DXY trending in 2013 in relation to metals / miners / commodities?
Thanks for the reply John. This decline has been intense, lots of people are doubting the bull in gold. I'm still on board, but really looking forward to a change in trend.
ReplyDeleteNext week should be exciting,
Alex.
Heads Up - as my wrote in my reply to Anon above, one HUI miner broke out and two
ReplyDeletemore joined the positive divergence BUY signal club.
A-B-C-D pattern - we are in the initial phase of the C-wave and enduring some complications
due to apparent market manipulations by Central Banks. In the meanwhile I have been looking
for the Commercial traders to flip over to the bullish side and this has recently happened.
So, as much as this has been confusing for a matter of a few months, the current and long-term
picture is now extremely favorable.
DXY - I have looked real intently at that for a while but my thought is that there is not a
way in h*** that Bernanke let's DXY get on a northward tilt for much longer.
Alex - that people are doubting the bull in gold is music to my ears. From the technical view of things, gold has made an extremely impressive sideways consolidation pennant pattern. After rising from $250 to $1900 in 10 years the downside of this consolidation is comparatively minuscule.
ReplyDeleteFor quite some time I have believed that our next target price will be a measured move equal or greater than this initial 10 year move. ie $250 to $1900 = $1650 gain + $1900 = $3550 next stop.
And on the fundamental side the case for future gold appreciation via demand is nearly bullet proof in my mind. The main drivers being the debasement of currencies around the world, the specter of this debasement turning into inflation and recessions or depressions, and the obvious preparation several key nations on the other side of the world are taking to replace the US Dollar as the World Reserve Currency.
John, what's your timeline for the rise to 3550? Marty Armstrong's computer model says gold's real rise won't start till late 2015. Maybe financial repression can last longer.
DeleteThanks John, what's the blees this week for gold?
ReplyDeleteAnother 20% drop in the miners, then a rebound. That means GDX at $30. Good luck holding till then.
ReplyDeleteJohn,
ReplyDeleteHUI down another 10 points.. when is your reversal going to happen. We seem to be breaking down and down the HS pattern on the HUI and targeting 180.
yes, fuse is lit. target 21 silver. lol
ReplyDeleteHUI / GDX - The Fuse is Lit ... Cover your ears... ... ...
ReplyDeletethud
so much for the lady-finger...
but I as the crowd rushes in to pick it up,
I see a stick of dynamite lying right next to it with the fuse lit!
John,
ReplyDeleteNice work spotting the positive divergences. This is really monitoring the heartbeat of the miners.
As I mentioned on an earlier blog entry ...I don't think we are there yet. Indeed the C-Wave commencement and B-Wave bottoming are being blurred with the "abnormal" activity.
Have you ever considered using the XAU which is a broader index than the HUI?
IMHO I think the miners will indicate the next C-Wave move in Gold. First movers (miners)will be indicative of change of sentiment for Gold. They will forecast to the market the impending move higher. The price manipulators will change their pattern and will shift there exposure before the move. What you have highlighted could very well be the start of that process.
I will sit tight before wading back in and adding to my existing miner portfolio notwithstanding the undeniable gift they currently offer.
Due consideration needs to be given to the S&P in general. PE's have not adjusted to a more sustainable level and are too optimistic in light of the current economic indicators. Additionally the market is progressively becoming thinner in trade volume. This does not bode well for a market that sits on the doorstep of its all time high. Where is the required participation ? An adjustment (market correction of >10%) is necessary to highlight the value in miners. Gold will have bottomed when the stock market fails. Sentiment will reverse and the masterminds will set in motion the next c-wave in gold and miners.
Your objective on the price level $3500 gold is consistent with my thought patterns.
I have this number hardwired into my investment agenda. How we both arrive there is where we differ. I do find it interesting that you achieve the same number that I do using other logic. More than coincidence I think.
The "fundamental" case for gold is irrefutable. This has been true for millennia. The price fixers are doing their utmost to ensure its true "value" is not achieved. As we know, the forces of nature will, in due course, rule.
Keep up the excellent work.
john,
ReplyDeleteplease read this article.
http://mobile.bloomberg.com/news/2013-03-04/mining-minnows-burning-cash-signal-more-mergers-coming.html
You have had a lot of positive write ups on miners which has helped me tremendously during the past few weeks. I have been holding old turkey since fall 2012. However, miners just keep falling and falling. So much negative news.
John, is it time to sell while my miner positions in GDX and GDXJ still worth something?
Thank you. And thanks for sharing your research and findings.
A
A - I read the Bloomberg article you provided. Interesting because I clearly recall the exact same thing being touted in late 2008. At that time the argument that the smaller miners could not get money via large loans seemed plausible. The banks were afraid to loan to each other because they did not know which of the brethren were holding toxic assets and therefore likely to not only fail to repay their loans, but downright close their doors and go belly-up. This liquidity freeze threatened to strangle the economy until Henry Paulson came up with $600B in new money and months later Bernanke began QE1.
ReplyDeleteThat was 2008. But this is 2013. There is no liquidity freeze now. For nearly 5 years we have created thousands of billions of dollars, spread it around liberally to all the banks and even taken the toxic assets off their balance sheets. It seems almost laughable that the claim is now made that there is no money to loan small miners.
Fortunately, I just write about things that interest me and that I hope others will also find interesting, if not encouraging. I am not in a position to offer financial advice and that is fine with me. But I can say out loud what I think and what I am choosing to do with my personal financial responsibility.
For my part I can say without equivocation that I am not selling and wish I could buy more. I really do not give a damn if GDX trades down to $5. It will not change my viewpoint one iota. It will not *scare* me into selling, in other words. I view the current situation as one that could turn on a dime at any moment and I do not want to miss that. But should the turn not come soon, and months from now prices are indeed much lower than they are today, well, tough. Too bad for me in 2013. Just be sure to check in with me in 2014 or 2015 and see who has the last laugh.
how does $USD look short term & long term?
DeleteJohn - very kind of you to respond. And thank you for letting us know what you intend to do with your own holdings. Very much appreciated. A
ReplyDelete