I have recently spent a number of weeks writing a computer script that runs on the Think or Swim platform. The script's output details the 119 daily and 30 weekly cycles of gold from its February 16, 2001 secular bull genesis to the present. Also, as gold has traded in a continuous repetitive ABCD pattern and is presently completing its 8th iteration of the pattern, the details of this pattern will be included in the three charts that follow.
Before we roll up our sleeves and start looking at the charts I'd like to give you a brief preparatory review of what you will be looking at, then we will be off to the daily gold futures charts and the colorful signals I have ascribed to the cycles analysis.
The primary structural component of gold's secular bull price movement is the weekly cycle (also known as the intermediate cycle). As we will examine in the charts, this cycle provides the pivot points of the ABCD waves and will be easy for you to observe.
The average length of gold's weekly cycle is 94 trading days or approximately 4.5 months. Nested within each weekly cycle are shorter cycles known as the daily cycles. Daily cycles average 24 trading days. And interestingly, I have recently discovered a four hour cycle that is nested within each of gold's daily cycles but I will write more about that another time.
A cycle is measured from its initial low to a subsequent low that is usually near the expected average cycle length. This measurement is divided in half to determine whether the highest price achieved within the duration of the cycle occurred before or after this midpoint calculation. If the cycle's high occurred after its midpoint measurement, the cycle is referred to as right translated. And if the cycle's high occurred before its midpoint measurement, the cycle is referred to as left translated.
It turns out that this translation issue is a critical piece to understanding gold's cycles and can be very helpful when anticipating the direction of future price movement. This is because cycles that are right translated usually make a higher low when they bottom and begin anew whereas cycles that are left translated usually make a lower low. Also, when a cycle begins at a certain price and concludes at a lower price, the cycle is referred to as 'failed'. This is very common for left translated cycles and not so for right translated cycles.
In gold's secular bull there have been 119 completed daily cycles of which 39 were left translated and 80 right translated. One could generalize that 33% of the time gold's daily cycles are left translated and 67% of the time right translated. But there is a little more to the story.
The interspersion of this ratio is not particularly random, fortunately. Indeed, the general tendency is for a weekly cycle to begin and continue with a series of right translated cycles, then conclude with one, perhaps two left translated cycles. For example:
27 of gold's 30 weekly cycles began with a daily cycle that was right translated. Obviously, buying at the beginning a new weekly cycle has high odds for success.
On the other hand, 25 of gold's 30 weekly cycles concluded with a daily cycle that was left translated. 27 of the 30 weekly cycles concluded with a daily cycle that was failed and 29 of the 30 weekly cycles concluded with either a left translated daily cycle, a failed daily cycle, or both. Obviously, buying toward the end of a weekly cycle is a good way to take a position that goes under water quickly and does not recover for some time.
The ABCD wave pattern is quite straight forward. The A-wave is usually a sharp rally that follows the severe drop in price that occurs during the profit taking D-wave. The A-wave has been just one or two daily cycles in length, with the exception of the A-wave that followed the severe D-wave in 2008. That A-wave was 3.5 daily cycles. The B-wave is a corrective move to the explosive A-wave and has occurred in the form of either one, two or three daily cycles. The C-wave is the longest wave in terms of time duration and concludes with a parabolic finale.
OK - let's get a chart up and see what all this really looks like. First we will begin with a look at the earliest years of gold's secular bull, 2001 - 2005.
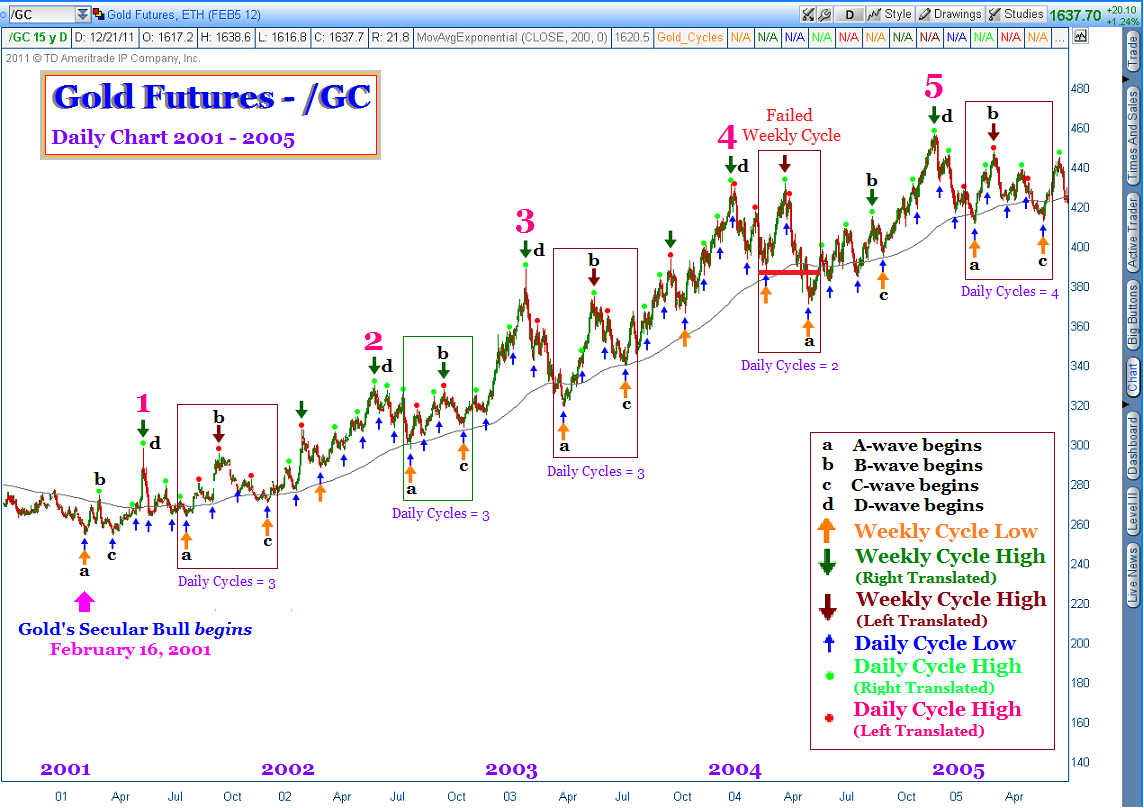
The building blocks of gold's repetitive ABCD, the weekly cycles, are located by large upward pointing orange arrows under each weekly cycle low. I chose to place the abcd identifiers at the beginning of their respective wave. Indeed, C-waves conclude with a parabolic top, but d-waves also begin at a parabolic top, as well. In any event, I have sequentially numbered each C-wave event with a large hot pink numeral.
The downward pointing large arrows are either dark red (left translated weekly cycle) or dark green (right translated weekly cycle). The red and light green dots spot the precise location and translation of each daily cycle.
I have used a rectangular box to highlight the weekly cycle following each C-wave top. Remember my noting that there were 30 weekly cycles? Well, what I did not tell you was that of these, only 7 were left translated. AND, these 7/30 left translated weekly cycles ALL occurred in the weekly cycle following a C-wave top.
Does that sound random to you? It does not sound random to me. In fact it sounds rather predictable.
Before we move on to the second chart I would like to call your attention to the 2002 C-wave top that was followed by a right translated weekly cycle. That is a bit novel. And also notice that the early 2004 C-wave top was followed by a failed intermediate cycle. Truth be told, when a cycle that is left translated does not fail - that is bullish. The other rectangles on this chart all dodged the bullet and managed to bottom higher than their beginning.

This second chart shows gold futures price activity from 2005 - 2009. Note that the 5th C-wave parabolic is shown at the conclusion of the first chart and here at the beginning of this second chart. Please also note that the 2006 and 2008 C-wave parabolas were followed by weekly cycles that were left translated, and that the 2008 specimen, like the early 2004 example, was not only left translated but also a failed cycle.

Which brings us to this final third chart. C-wave top #7 (2008) appears on this chart, as it did in the previous chart.
What I find curious is our current situation, identified by the dark green rectangle. I have temporarily identified the bottom achieved last week as the conclusion of the weekly cycle following our recent C-wave top with the large orange upward pointing arrow. But here is the quandary - it is a right translated weekly cycle (dark green, not dark red). If the final daily cycle had persisted for another week or so, then the weekly cycle would have been dark red and left translated. But the recent sell off was so severe it apparently shortened the most recent daily cycle.
If you recall the first chart, the 2002 C-wave was followed by a right translated (dark green rectangle/arrow) weekly cycle. But that is the only time this has happened. Each and every other example following a C-wave top included a left translated (dark red rectangle/arrow) weekly cycle.
Is it possible our current weekly cycle really has not yet bottomed? And that the current daily cycle is going to not only be left translated, but also fail and trade lower than its $1562 beginning? For myself, if gold does trade below $1562 I will sell sell sell because without a doubt in mind we will be heading even lower. An even more bearish scenario would be for gold to trade a penny below $1535 as that would be the very definition of a failed weekly cycle. Our two previous examples of that (2004 and 2008) should be warning enough.
I'll be watching my four hour cycles software with a keen eye in the near future as I suspect it will tip me off should this situation begin to turn on my long positions. I'll keep you posted.
Good luck and when you figure out how this is going to turn out before I do, please let me know.
John
tsiTrader@gmail.com

![[Most Recent Quotes from www.kitco.com]](http://www.kitconet.com/images/quotes_special.gif)


Hi John, I'm wondering how this system works out with the dollar? As you know all the news out of Europe and the Euro seems to have a large effect on the dollar, which effects gold & silver. I think the research on these cycles is just great, but with so much headline risk I always wonder what kind of news will disrupt these cycles and whip the dollar around?
ReplyDeleteJohn,
ReplyDeleteWow! Excellent analysis! Very thorough, great info and stats to help us trade this beast. Many thanks!
Mark - it is a highly manipulated world we live in - that is my opinion. I do not think there is an indicator in the world that can tell the future. Certainly not with 100% accuracy, 4 sure. That includes cycles.
ReplyDeletepimaCanyon - I hoped you would like this post.
John-
ReplyDeleteExcellent charts....
John - very insightful. Pro PM market observers ay sentiment in this sector is real low. Even die hard strong hands are beginning to question what's going on. This is not typical of a market top.
ReplyDeleteLets grind on thru new years. Tax selling abates and something hits the fan. Maybe then off to the races.