skip to main |
skip to sidebar
Click on any chart to ENLARGE
With just minutes left on today's week concluding session I took a look at my position in Direxion Gold Miners Bear 3X ETF (DUST) and hit the sell button. Nothing in particular was wrong with the chart technically, I just felt like taking my marbles and going home for the weekend.
While studying the weekly charts of the World Gold Index (XGLD) and looking at the placement of each ABCD wave, I began to notice something I had not seen before. Ever.
I'll show you what caught my eye with the following three charts of the Gold Index. My training/tinkering with gold's cycles, whether they be the four hour, daily or weekly (intermediate) variety, has included an appreciation for the violation of a cycle's price trend line before its conclusion. This trend line break is not a certainty I guess, but a virtual certainty.
So I got to wondering if the ABCD pattern of gold's secular bull market also exhibited this characteristic. That is, has price in every instance broken the trend line of the ABCD pattern before beginning a new ABCD pattern?
Our first weekly chart is the Gold Index from 2002 - 2005. As you can see, there were three complete ABCD patterns in this time frame and indeed, the trend line of each was broken by price before beginning a new ABCD pattern.
The 2003 pattern saw price come down and touch the trend line during the D-wave. But as we will see in other examples, apparently just touching the trend line is not the characteristic of a completed ABCD pattern.
Our second chart looks at the late 2004 C-wave top and continues with the 2006 and 2008 specimens. The introductory price movement of the 2006 example was so flat there was virtually no trend line. That is, the A-wave bottom ($410.10) and C-wave bottom ($413.50) were unable to give an accounting of the ABCD pattern's price trend.
An up sloping price trend line did finally emerge and surprise, surprise ..... it was finally violated by the 2006 D-wave the very week that defined the beginning of the 2008 ABCD pattern.
Also, the late 2004 example, like the 2003 ABCD, found price reach the up ward trend line, but it was not until this trend line was breached a couple of weeks later that the D-wave concluded and an A-wave begun anew.
Finally, let's have a look at the most recent ABCD activities.
On the far left of the chart is the conclusion of the 2008 example - and again note that price tagged the trend line near the conclusion of the D-wave, but it was not until the trend line was clearly penetrated that this D-wave came, mercifully, to a final conclusion.
And on the far right of the chart is the parabolic top of 2011 and we note that the trend line of this ABCD pattern has already been touched by price - but not penetrated.....yet.
My TSI Trading Record has been updated.
I set a limit order to buy Direxion Gold Miner Bear 3X ETF (DUST) and headed off to work. OK - that was a mistake. My order was hit and price continued to fall. So I bought more. lol
This is a four hour chart of DUST.
My TSI Trading Record has been updated.
Ah heck - I decided to go ahead and make a proper one hour chart of DUST.
Well, call me paranoid about this gold rally if you wish, but I have banked modest gains on both of my trading positions and 2012 is off to a fine start!
I continue to believe the likelihood of gold making a final plunge towards $1400 is high so I am satisfied to sit in cash as I watch things develop.
This first chart is of Proshares Ultra Silver 2X ETF (AGQ) which I sold for $47.50. This is a 15 minute chart which is usually not the best time frame for making decisions about trends (to say the least). But I think I got most of the easy money off the table and that is all I really care about.
This second chart is my sale of Direxion Gold Miners Bull 3X ETF (NUGT) at $21.55. This chart uses the 30 minute time frame. The chart shows us that in just 2.5 trading sessions price has travelled from a low of $17.09 to a high of $21.83. That amounts to a nearly 28% move from low to high. It seems to me the old addage "what goes up must come down" . We shall see if this time is the exception (but not with my money - lol).
This third chart is a quick look the one hour chart of the gold futures (/GC). Again, nothing goes straight up forever.
Fourth up is a four hour chart with the gold futures cycles included. We are currently on bar 15 of what seems to be a 40ish bar cycle. And, we are beginning a new daily cycle as well.
In the past 9 months, all of the first four hour cycles nested within the daily cycles were right translated, except one. So odds favor this current rally will not top until tomorrow or later.
And finally, this beautiful chart of Gold Futures was sent to me earlier today by the inventor of a new momentum indicator for the Think or Swim platform called the TrendXplorer, by JW of http://indexswingtrader.blogspot.com. I'm curious to learn more about the signals it renders and think the use of color is exceptionally effective.
My TSI Trading Record has been updated.
With trading about to begin for the New Year 2012, how about we take a look at the gold miners and see where they are positioned. We will begin with a couple of charts of the stock I wrote about a week ago, Cardero Resources Corp (CDY) , then examine the status of Market Vectors Gold Miner ETF (GDX) with the Bullish Percent Gold Miners indicator ($BPGDM) from StockCharts and conclude with a look at both the Market Vectors Junior Gold Miners ETF (GDXJ) and the Direxion Daily Gold Miners Bull 3X ETF (NUGT).
I wrote about the bargain price of Cardero Resources Corp (CDY) about a week ago. At that time the stock traded for $0.95 per share and at a Book Value of just 57 cents on the dollar. Since that day CDY was made a little improvement in its price, closing last Friday at $1.02.
So did I buy CDY at $0.95? Nope. But I have heard from readers who did buy CDY at something close to $0.95 and I am very happy for them! I placed a Good til Cancelled (GTC) order to buy CDY at 90 cents - which has not been filled. Most likely I will raise my offer this week and make sure I get some shares.
Let's begin with a look at the weekly chart of Cardero Resources Corp (CDY).
The most interesting point of this chart is the 6 year long resistance line that currently is at about $1.86 overhead. I am using a moving average of 40 on this weekly chart that roughly equates to the 200 dma. We note that a couple weeks ago CDY made its first (failed) attempt to reach and get through this 200 day moving average equivalent.
This second chart is a daily of CDY. The moving average of 40 is still used (unfortunately) but the 200 dma currently comes in at about $1.28. A shorter term overhead resistance line is identified and is also at about $1.28. The longer term resistance line identified in the weekly chart (above) is still seen as $1.86 and likely to be at $1.80 by early March.
Moving on to GDX, let's first take a look at its infamous 2008 low with the $BPGDM indicator from StockCharts. This particular indicator measures the percentage of gold miner stocks in the HUI index (15 mining stocks) that currently have a BUY signal on their point and figure charts. I have programmed the ThinkorSwim platform to render the $BPGDM indicator while showing the price movement of GDX in the background.
Usually the $BPGDM indicator does a very good job of spotting lows and highs in the GDX/HUI mining index. My sense is that it does that within the context of a trending higher or lower environment. However, at turning points in major trend direction, $BPGDM gives a better interpretation if one considers its divergences with price movement.
I know this sounds a bit confusing, but let me attempt to explain.
This indicator is the percentage of mining stocks in the $HUI index (15) that are yielding a BUY signal on their point and figure charts. My take on point and figure charts is that they do not accurately trigger BUY signals without a considerable delay at turning points. In other words, whereas the True Strength Index (TSI) indicator is a leading indicator, the $BPGDM is a lagging indicator in turning point situations.
Why? Well, when the GDX/$HUI is on a SELL signal with the $BPGDM indicator, the $BPGDM does not issue a BUY signal at a trend reversal without a considerable lag. My explanation for this is that not all stocks within the mining index conclude their bottoming process at the same time. A few inevitably bottom after the majority - and before the majority achieve a buy signal per the definition given by the point and figure charts indicator. In other words, there are a few stocks that reach the SELL definition before several others reach the point and figure BUY definition - thus driving the indicator lower towards ZERO (when in fact the majority of mining stocks are rising).
Anyway, my analysis is that we are close to a D-wave bottom in gold and that the miners may have already put in their bottom, though I think it highly likely at some point in the next week or two miners will again fall towards a retest of their low.
Above is the current daily chart of GDX. The highlights of this chart are the bullish bounce off the lower trend line of the 14 month megaphone pattern. Other things to keep in mind include the TSI below ZERO, the positive divergence already in place, the trend line break that appears imminent, and the ZERO crossover of the TSI that will inevitably occur.
The current daily chart of GDXJ is essentially more of the same, like GDX. Most likely the absolute bottom is in, but it would not surprise me to see a final shake out.
Our final daily chart is of Direxion Gold Miners Bull 3X ETF (NUGT). As readers may recall, I own (what is for me) a substantial position in NUGT, acquired at $20.25. When I added the megaphone resistance lines to the dates that were defined on both GDX and GDXJ, I began to chuckle. I am aware that this ETF went from being a 2X to a 3X sometime in the recent past and that perhaps that is the accurate explanation for this chart. Beats me and who cares? But what I find amusing is the complete breech of the lower resistance line of the megaphone pattern.
The breech of the lower resistance trend line is remarkable. Whatever the explanation, the purchase of NUGT below that line is a gimme, at least in my opinion.
However this plays out in the short term, I am convinced that one can and will make substantial gains with the purchase of miners, right now, in the next few months.
And you know what? I have not written these words for many months.
Good luck riding the Gold Bull. Sometimes, like now, the best thing is to just believe in the bull's intentions to continue much much higher - and not get thrown off when there is a downdraft - as I expect there may be in the relatively near future.
John
tsiTrader@gmail.com
Today, something significant happened in the gold market.... and it's not good news for the bulls, at least short term.
The current weekly (intermediate) cycle began on September 26th with a low price of $1535 became a left translated weekly cycle on December 22 when the count of days within the weekly cycle reached 63. The cycle's high of November 8th (Day 31) then became left of the cycle's center.
But as I recently pointed out in Gold's Secular Bull Cycles and Its ABCD Pattern, each and every C-wave top has been followed by a left translated weekly cycle except the 2002 C-wave. The odds therefore were very high that our current weekly cycle, which has followed the $1923.7 C-wave top of September 6th, would also be left translated.
However, the left translated cycles that have followed all but one C-wave, curiously, were not failed cycles - except for the early 2004 and 2008 C-waves. A failed weekly cycle is one in which the cycle bottoms lower than the price where it began.
Here is a daily chart of the 2003 - 2006 cycle data for gold.
The early 2004 C-wave was followed by a weekly cycle that was a failed weekly cycle. When a cycle fails price will continue to fall sharply and when it finally bottoms, the A-wave begins with a very powerful rally.
Here, let's take a closer look at the early 2004 example to see the failed weekly cycle in more detail.
In this case, the weekly cycle bottomed 7 or 8 days after the failure.
In 2008, gold investors were not so fortunate to simply endure a week or two for things to start getting better.
In this case, price sliced right through the failure line and kept going, only to decide to retest that price level (unsuccessfully) and then take everyone on a fantastic ride into outer space..... crashing for one week and soaring for the next..... seemingly over and over again.
Last summer I wrote about a post titled, Gold C-wave Tops and D-wave Retracements. My research detailed each of the 6 historic examples with measurements of D-wave price retracement of the C-wave that preceded it, trading day tally for each D-wave, and the relative speed in terms of trading days that each D-wave plummeted to reach key Fibonacci levels.
With today's breach of the current weekly cycle perhaps this would be an opportune time to refresh our memories on the kind of damage D-waves do to the price of gold.
The following chart shows the entire 2009 - 2011 C-wave that concluded September 6th and applies some Fibonacci measurements to this C-wave's $1058.7 rise above its $865 beginning.
It is a bit scary to see the historic retracements of the previous 6 D-waves and apply them to today's situation. We have a retracement to date of 38%. I would put the odds that gold has finished falling at about ZERO. And I would put the odds that gold reaches $1400 at 80 - 95%.
Some readers have been writing to inquire about my work on the four hour cycle of gold - and what it is telling us now, if anything. The following chart jumps us in a new direction with an overview of the past 180 trading days that www.thinkorswim.com platform makes available for the 4 hour time setting.
For starters, the blue counts are the bar lengths of each four hour cycle. These measurements have ranged from 57, 55 and 50 on the long side to 28, 31 and 36 on the short side.
The purple counts are a calculation of the number of trading days in each daily cycle at its concludion. These daily cycles have ranged from 14 to 28 days. My own research on the entire lot of daily cycles from 2001 to present is that daily cycles average 24 days.
The next chart zooms down the time frame to just the current weekly cycle.
Some quick things to note. There have been 3 completed daily cycles in this weekly cycle (18.8, 23 and 27.3 days each). Within each daily cycle we find the nested four hour cycles. The first two daily cycles had three nested four hour cycles. The third daily cycle had four. We have just begun a new daily cycle - literally at 8:00 am cst this morning. And that means we will have more nested four hour cycles before the conclusion of this daily and weekly cycle.
If you would like to study the number of four hour cycles that are nested within each daily cycle just look at the chart that preceded this one!
Well, getting down to the nitty-gritty now. Here is a chart of the four hour cycles up close with the TSI BUY/SELL signals below price.
We see that price has bounced after crashing through the failed cycle level of $1535 (as in the 2004 example), the slower trending TSI (25,25) has turned from red to green, indicating a likely change in trend direction, and the TSI (7,4) has signaled a trend line break BUY (green dot).
BTW, the small red/green dots above price locate the four hour cycle high - red is for left translated, green for right translated.
OK - so where do we go from here?
Lower, obviously. But maybe enough of a bounce in the very short term that I can keep a sale of my NUGT and AGQ positions from being too embarrassing. (lol)
If that does not work out for me I will stand aside and look the other way for awhile. It's a bull market, after all! Those of you who can wait - you are about the get the buy of a lifetime. Let's all keep an eye on it together, OK?
John
tsiTrader@gmail.com
I keep forgetting to update my purchase of AGQ (Silver Bull 2X ETF) on the open this past Monday morning at $46.72. Sorry about that.
My TSI Trading Record has been updated.
I anticipate purchasing shares of Cardero Resources (CDY) when post-Christmas NYSE trade resumes on Tuesday.
Mining stocks, as you are well aware, are very out of favor right now. Indeed, the $BPGDM (Bullish Percent Gold Miners Index) that is available for examination at www.stockcharts.com is at lows that should be close to a bottom. At present it is reading just 13.79 - which is the percentage of mining stocks in the index with BUY signals on their point and figure charts.
Unfortunately, it's entirely possible that miners have not finished their wash out process - particularly as gold itself may have a final leg down to conclude this weekly cycle.
So, with a bit of caution in mind I decided to look at miners that looked as though they were not likely to have much, if any, downside left. While looking at over 200 charts I rediscovered an old friend - a company I have followed for a couple years now, know something about and have traded very successfully in the past. And that company is Cardero Resources (CDY).
Cardero trades on the AMEX exchange. Of all the charts I looked at, Cardero is currently priced closer its 2008 low than any other mining company one could take seriously. Additionally, of all the mining stocks on the AMEX, CDY trades at the lowest price to book value ratio of any - an incredible 57% of book value. Now that is a discount if I ever saw one.
CDY has a small float of just 91M shares outstanding - this figure includes a recently closed private placement of $7.6M. And, the company has ZERO debt.
I'll offer some thoughts on 'why' Cardero is currently mispriced, but how about we take a look at some charts.
From a technical perspective CDY seems to have a few things going for it. First, what appears to be an inverted head & shoulders pattern on the daily chart suggests a minimum price move of 57% could be in the offing. Additionally, the TSI would not need much encouragement to render a Trend Line Break BUY signal with an additional ZERO crossover BUY signal presumably not too far away.
This is a longer term look at CDY and its weekly chart.
We can see that the 2008 bargain basement low was $0.73 and recently CDY traded as low as $0.74. However, when investors have turned their back on this stock for too long, sharp rallies can quickly carry the stock up to $2, $3 and even $5. That is explosive.
Last chart - a daily of the Market Vector Coal ETF (KOL).
Here the inverted head & shoulders pattern is a little clearer to see than in the CDY specimen. Curiously enough, it also projects a minimum price gain in excess of 50%.
Is there something wrong with the Cardero company, some bad news, to explain its current bargain price? NOPE.
There is a lot of background information that I am going to omit - I'm just not interested in spending 3 more hours reciting it all. If this stock interests you then by all means read all the SEC filings, commentary on Yahoo and Fool and tear through the company website (www.cardero.com).
Having done that for myself I conclude that the stock price is suppressed as it is in an extremely out of favor industry group - miners. On top of that, Cardero does not have a project that is already producing revenue. Further, the company, while having a major position in a coal mining operation, has it's financial resources spread out over several other smaller mining operations that include coal, but also iron, titanium, gold, silver, zinc. If that were not enough for analysts/investors to keep up with, CDY also owns stock in a couple of other mining companies (investments) that amounts to about 30% of their net worth. Add to that December tax loss selling and the plate is full of (temporary) negatives.
I believe that the investment community goes through periods where this company does not fit into some nice box and is periodically removed from their radar screens...... I believe that to be the case at the present time.
A couple of final observations. First, it is important to appreciate how Cardero got to where it is today. Seven years ago the company purchased the Pampa de Pongo iron ore deposit in Peru for $1M.
Six years later they sold it for $100M.
And secondly, their coal mine operation just released a preliminary economic assessment. The project contemplates a net after tax and expenses profit of $115M per year after mining begins.
Remember, CDY has ZERO debt, only 91M shares and sells at .57 Book Value.
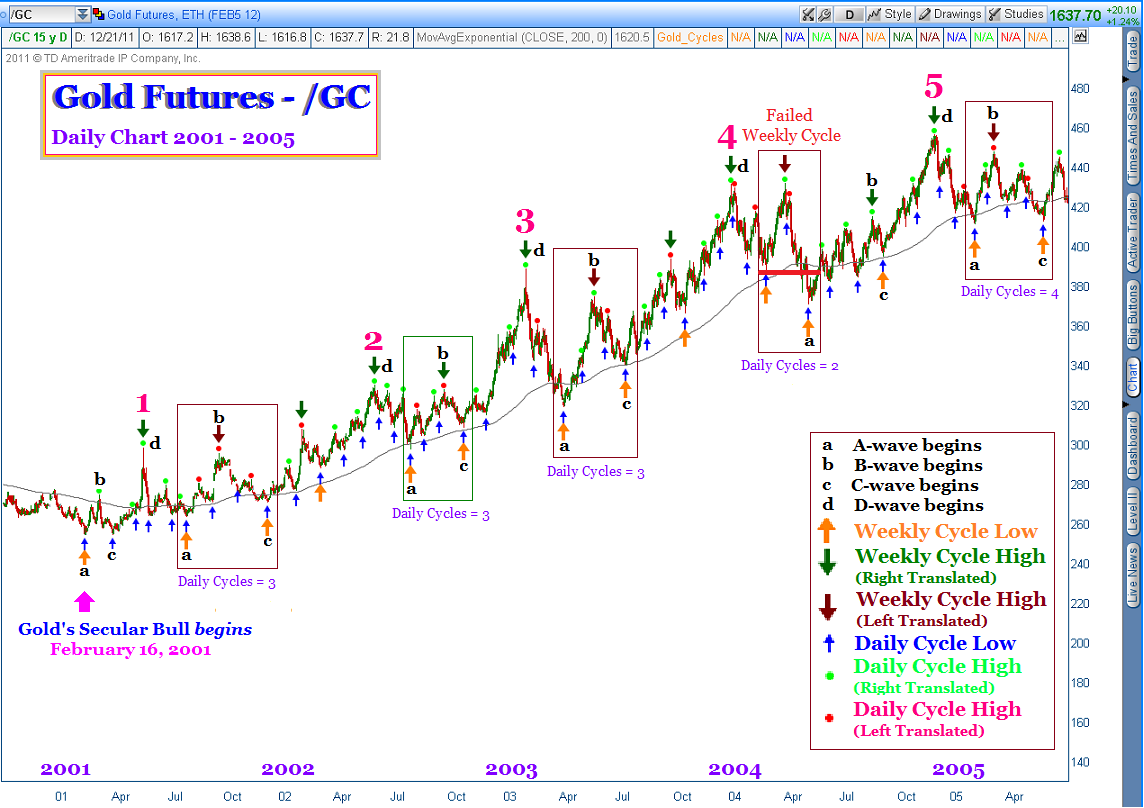
I have recently spent a number of weeks writing a computer script that runs on the Think or Swim platform. The script's output details the 119 daily and 30 weekly cycles of gold from its February 16, 2001 secular bull genesis to the present. Also, as gold has traded in a continuous repetitive ABCD pattern and is presently completing its 8th iteration of the pattern, the details of this pattern will be included in the three charts that follow.
Before we roll up our sleeves and start looking at the charts I'd like to give you a brief preparatory review of what you will be looking at, then we will be off to the daily gold futures charts and the colorful signals I have ascribed to the cycles analysis.
The primary structural component of gold's secular bull price movement is the weekly cycle (also known as the intermediate cycle). As we will examine in the charts, this cycle provides the pivot points of the ABCD waves and will be easy for you to observe.
The average length of gold's weekly cycle is 94 trading days or approximately 4.5 months. Nested within each weekly cycle are shorter cycles known as the daily cycles. Daily cycles average 24 trading days. And interestingly, I have recently discovered a four hour cycle that is nested within each of gold's daily cycles but I will write more about that another time.
A cycle is measured from its initial low to a subsequent low that is usually near the expected average cycle length. This measurement is divided in half to determine whether the highest price achieved within the duration of the cycle occurred before or after this midpoint calculation. If the cycle's high occurred after its midpoint measurement, the cycle is referred to as right translated. And if the cycle's high occurred before its midpoint measurement, the cycle is referred to as left translated.
It turns out that this translation issue is a critical piece to understanding gold's cycles and can be very helpful when anticipating the direction of future price movement. This is because cycles that are right translated usually make a higher low when they bottom and begin anew whereas cycles that are left translated usually make a lower low. Also, when a cycle begins at a certain price and concludes at a lower price, the cycle is referred to as 'failed'. This is very common for left translated cycles and not so for right translated cycles.
In gold's secular bull there have been 119 completed daily cycles of which 39 were left translated and 80 right translated. One could generalize that 33% of the time gold's daily cycles are left translated and 67% of the time right translated. But there is a little more to the story.
The interspersion of this ratio is not particularly random, fortunately. Indeed, the general tendency is for a weekly cycle to begin and continue with a series of right translated cycles, then conclude with one, perhaps two left translated cycles. For example:
27 of gold's 30 weekly cycles began with a daily cycle that was right translated. Obviously, buying at the beginning a new weekly cycle has high odds for success.
On the other hand, 25 of gold's 30 weekly cycles concluded with a daily cycle that was left translated. 27 of the 30 weekly cycles concluded with a daily cycle that was failed and 29 of the 30 weekly cycles concluded with either a left translated daily cycle, a failed daily cycle, or both. Obviously, buying toward the end of a weekly cycle is a good way to take a position that goes under water quickly and does not recover for some time.
The ABCD wave pattern is quite straight forward. The A-wave is usually a sharp rally that follows the severe drop in price that occurs during the profit taking D-wave. The A-wave has been just one or two daily cycles in length, with the exception of the A-wave that followed the severe D-wave in 2008. That A-wave was 3.5 daily cycles. The B-wave is a corrective move to the explosive A-wave and has occurred in the form of either one, two or three daily cycles. The C-wave is the longest wave in terms of time duration and concludes with a parabolic finale.
OK - let's get a chart up and see what all this really looks like. First we will begin with a look at the earliest years of gold's secular bull, 2001 - 2005.
The building blocks of gold's repetitive ABCD, the weekly cycles, are located by large upward pointing orange arrows under each weekly cycle low. I chose to place the abcd identifiers at the beginning of their respective wave. Indeed, C-waves conclude with a parabolic top, but d-waves also begin at a parabolic top, as well. In any event, I have sequentially numbered each C-wave event with a large hot pink numeral.
The downward pointing large arrows are either dark red (left translated weekly cycle) or dark green (right translated weekly cycle). The red and light green dots spot the precise location and translation of each daily cycle.
I have used a rectangular box to highlight the weekly cycle following each C-wave top. Remember my noting that there were 30 weekly cycles? Well, what I did not tell you was that of these, only 7 were left translated. AND, these 7/30 left translated weekly cycles ALL occurred in the weekly cycle following a C-wave top.
Does that sound random to you? It does not sound random to me. In fact it sounds rather predictable.
Before we move on to the second chart I would like to call your attention to the 2002 C-wave top that was followed by a right translated weekly cycle. That is a bit novel. And also notice that the early 2004 C-wave top was followed by a failed intermediate cycle. Truth be told, when a cycle that is left translated does not fail - that is bullish. The other rectangles on this chart all dodged the bullet and managed to bottom higher than their beginning.
This second chart shows gold futures price activity from 2005 - 2009. Note that the 5th C-wave parabolic is shown at the conclusion of the first chart and here at the beginning of this second chart. Please also note that the 2006 and 2008 C-wave parabolas were followed by weekly cycles that were left translated, and that the 2008 specimen, like the early 2004 example, was not only left translated but also a failed cycle.
Which brings us to this final third chart. C-wave top #7 (2008) appears on this chart, as it did in the previous chart.
What I find curious is our current situation, identified by the dark green rectangle. I have temporarily identified the bottom achieved last week as the conclusion of the weekly cycle following our recent C-wave top with the large orange upward pointing arrow. But here is the quandary - it is a right translated weekly cycle (dark green, not dark red). If the final daily cycle had persisted for another week or so, then the weekly cycle would have been dark red and left translated. But the recent sell off was so severe it apparently shortened the most recent daily cycle.
If you recall the first chart, the 2002 C-wave was followed by a right translated (dark green rectangle/arrow) weekly cycle. But that is the only time this has happened. Each and every other example following a C-wave top included a left translated (dark red rectangle/arrow) weekly cycle.
Is it possible our current weekly cycle really has not yet bottomed? And that the current daily cycle is going to not only be left translated, but also fail and trade lower than its $1562 beginning? For myself, if gold does trade below $1562 I will sell sell sell because without a doubt in mind we will be heading even lower. An even more bearish scenario would be for gold to trade a penny below $1535 as that would be the very definition of a failed weekly cycle. Our two previous examples of that (2004 and 2008) should be warning enough.
I'll be watching my four hour cycles software with a keen eye in the near future as I suspect it will tip me off should this situation begin to turn on my long positions. I'll keep you posted.
Good luck and when you figure out how this is going to turn out before I do, please let me know.
John
tsiTrader@gmail.com