There is no other way to describe silver's price movement of the past 13 weeks other than to call it parabolic. With that in mind, I thought it would be interesting to do a little study of past silver parabolic moves and see if I could get a handle on just how high silver could travel into December before it implodes.
*
Click on the charts to ENLARGE
*
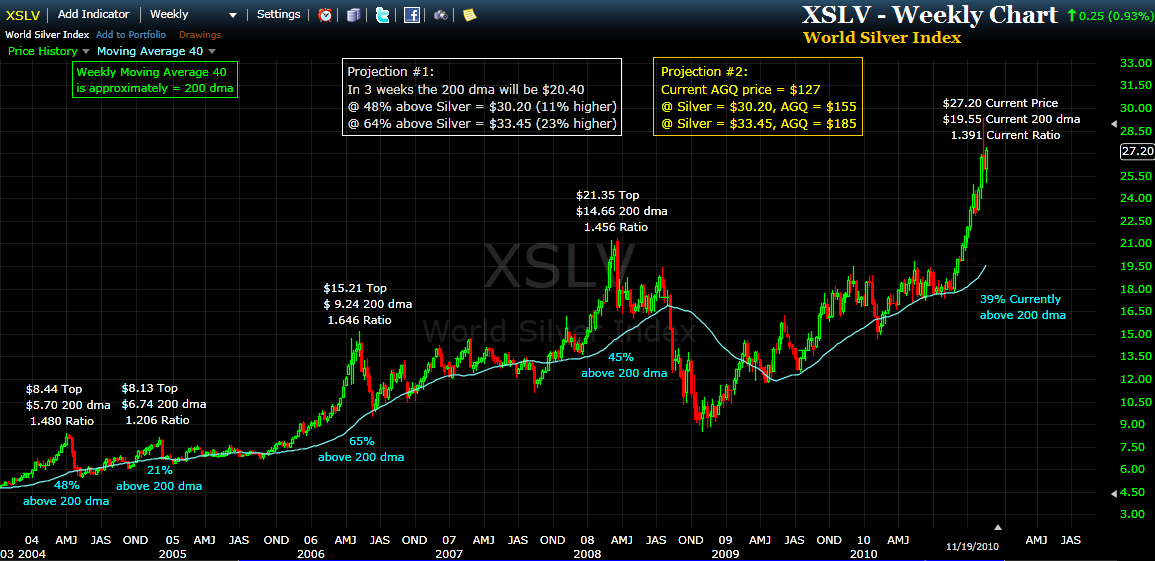
For this study I have chosen to examine the relative degree to which silver price can exceed its underlying 200 day moving average. This weekly chart of the World Silver Index (XSLV) uses the 40 week moving average as a proxy for the 200 day moving average.
*
Silver is currently making its 5th parabolic appearance since the secular bull market for gold and silver began in late 2001. The range that silver has been able to soar above its 200 dma in previous parabolic moves ranged from a modest 21% to a mind boggling 65%.
*
The rule of thumb for these kind of things is that the longer the consolidation period preceding the parabolic, the higher the concluding parabolic is likely to rocket. This understanding explains why the parabolic near the end of 2004 achieved only 21% above its 200 dma - as the consolidation period preceding it was a very brief 8 months.
*
The three other previous silver parabolics had consolidation periods of between 18-24 months. And these three were able to achieve heights exceeding the underlying 200 day moving average by 45%, 48% and 65%.
*
Our current silver parabolic has had a consolidation period utterly dwarfing all previous specimens - logging in at 33 months. It is conceivable this could be the mother of all parabolics for the current secular bull.
*
But not allowing myself to get too carried away, my chart offers a projection for silver in the range of the 3 more or less comparable predecessors. i.e. that the current parabolic will achieve a height of 48% to 65% above its 200 dma ($30.20 - $33.45). As silver closed this past week at $27.20, this range projects price higher some 11% - 23%.
*
If one is invested in Proshares Ultra 2X Silver ETF (AGQ), it is reasonable to double those projected results to amount to a forward gain of between 22% and 46%.
*
And don't forget, these calculations pretend that the consolidation period of the current parabolic is roughly identical to its predecessors. And it is not. It is nearly TWICE the size.

Here I offer a simple chart of Proshares Ultra 2X Silver (AGQ) with my likely modest forecast applied to the chart. I have arbitrarily chosen to guesstimate that this move will last approximately 3 weeks past today.
*
As gold appears to have begun a new 20-28 day cycle in just the past few days, it would be reasonable to assume that gold may now progress higher for approximately 3-4 weeks. The strongest seasonal price performance for gold occurs in the mid-November to mid-February time frame each year and that time window has just now been swung open. Also, in the past, the top in the daily/weekly cycle of gold has very closely lined up with the top of each silver parabolic move. So, about the time gold tops, so does silver. And unless one believes that gold has already topped, there should be plenty of time left on the shot clock for silver to complete its electrifying mission.
*
I know to many readers my thoughts may appear to be fantasy. But honestly, I don't know how to better explain what is going on with silver than the way I have.
*
The other thought I want to share is that while some of us are excited about buying this high momentum run, now is a good time to think about your plan for selling it. I really encourage each participant to think this one through before we get close to the parabolic top. It is infinitely smarter to make a decision based on premeditated rational thinking and then live its consequences, than turn into an emotional basket case and get run over by the freight train when it comes back the other direction.
*
Wishing you a highly profitable and rewarding month of December!
*
John
tsiTrader@gmail.com

![[Most Recent Quotes from www.kitco.com]](http://www.kitconet.com/images/quotes_special.gif)


I too am hoping for a significant move in Silver. However, there is reason for caution. This move had already put in a blow-off top. The other moves only had one real blow-off top and then prices built a new base. Can we muster enough energy to build a 2nd blow-off top when the other moves have not?
ReplyDeletejoe
Hi Joe - yes, I noticed that blow off-top in our current parabolic and gave it some thought before publishing my post. And indeed, anything is possible - so there are no 'guarantees' this silver parabolic will continue or that the stock market will not crash on Monday.
ReplyDeleteBut what I did notice was that there appeared to be one of these blow-off tops 4 weeks before the May 2006 parabolic top.
And there also appeared to be one of these blow-off tops 1-2 weeks before the March 2008 parabolic top.
The key reason I am optimistic, however, is that gold is just getting started on a new daily cycle that I think will last for quite a number of days, if not 2-3 weeks.
And also, silver is currently only 39% above the 200 dma. With the size of the consolidation that has preceded this parabolic in mind, it is difficult for me to imagine we are anywhere near done going skyward.
I know you are trying to restrain yourself, but wouldn't you agree that it wouldn't be hard to see 30 dollar silver before Thanksgiving Day and 35+ in the 3 weeks you have outlined?
ReplyDeleteI am trying to restrain myself as I don't want to become an ambulance chaser with no credibility, but to answer your question, yes, I could see $35 silver at the top. If that happens, I think one could look back at the research I have presented today and make the convenient claim (in hind sight)that it was a no-brainer silver would go to $35.
ReplyDeleteAs emotional as these 'money chasing' parabolics get, $35 is indeed a valid possibility, IMHO. But I am not going to presume that is how this turns out.....
Hi John,
ReplyDeleteYou told Gold may have begin a new daily cycle with a time frame of 20-28 days.
Daily cycles are bottom to bottom. What are the average days that normally Gold tops on daily cycles ? Isn´t 3 weeks for the top too much ? It will mean the end of Gold´s daily cycle, and his new bottom (the same thing to Silver).
Thks.
Carlos
Hi Carlos - you are correct that cycles are measured from bottom to bottom. Cycle tops can (and do) occur on any conceivable day count other than Day 1 or Day Last.
ReplyDeleteThe first two daily cycles of this Intermediate cycle begun on July 28 were unusually long (30+ days) and extremely right translated - meaning they topped far right of the center day. In fact, they topped just 3-5 days before the daily cycle bottom.
This most recent daily cycle topped on Day 13 of what now appears to have been a very short 18 day cycle.
If last Tuesday was the previous daily cycle bottom, we have used up 3 days since then and 3 additional weeks would add 15 days to that. Yes, if this cycle is a normal length of 20-28 days it is indeed possible to have a top that is not reached until Day 18 and a bottom that is not reached until Day 20-28.
My take on Silver is that when the economy starts on an advance the commercial use of silver will put a strain on the Silver supply.
ReplyDeleteThere is only a known 8-9 year supply including the supply that has not been mined.
W.BEELER