Friday, October 8, 2010

Thursday BUYS ONLY SFMI $0.17, CDY $1.18 and AGQ $90.90

*
I made no purchases or sales today, Friday, but am just getting around to posting my three purchases yesterday, which included SFMI, CDY and AGQ.
*
This first 60 minute chart is of Silver Falcon Mining (SFMI) which I purchased yesterday at $0.17.  SFMI traded as low as 15 cents earlier this morning, but near the close of the week is sitting at $0.175 and reached 18 cents earlier this last hour of trading.
*
Click on the charts to ENLARGE
*
This second 60 minute chart is of Cardero Resource Corp (CDY) for which I accumulated additional shares yesterday at $1.18.  At this moment CDY is trading at $1.19 after trading as low as $1.15 earlier this morning.


*
My third and final purchase yesterday was of Proshares UltraSilver (AGQ) at $90.90. AGQ is currently trading at $94.15, up 6.20% for the day.
*
This is a current picture of silver on a 10 minute chart.  Sure looks like a cup and handle pattern to me.
*
My TSI Trading record has been updated.


Wednesday, October 6, 2010

SOLD PZG $1.85 NSU $5.15 SFEG $1.13 SFMI $0.17 SILA $0.81

*
I had a limit order to sell Paramount Gold Mining Corp (PZG) at $1.85 that was just taken in the pre-market.
*
Not included in my trading record of stocks are my activities trading futures, as it would seem difficult to compare apples with oranges - I am not really sure how I would record futures trades and make them comparable to stock trades.  Anyway, I had three separate trades overnight shorting the US Dollar and all three worked out for modest gains.  
*
Click on the charts to ENLARGE
*
I took profits in 4 stocks today.  Honestly, this batch of stocks have been an unusual collection of duds and I was glad to get them out of my portfolio.
*
The first sale was of Nevsun Resources Ltd (NSU) at $5.15.
The second sale was of Santa Fe Gold Corp (SFEG) at $1.13.


The third sale was of Silver Falcon Mining (SFMI) at $0.17.
The fourth and final sale was of Silver America Inc (SILA) at $0.81.
*
My TSI Trading record has been updated.

Monday, October 4, 2010

SOLD CMIN $0.33

*
Today I sold another batch of Constitution Mining Corp (CMIN) at $0.33.  I had a limit order in place for 33 cents - looks like the stock sold above that to 34 or better, but I missed that action with my limit order.
*
Click on the chart to ENLARGE
*
My TSI trading record has been updated.

Sunday, October 3, 2010

Timing is Everything (or is it?)

*
I have about 135 mining stocks that I follow each day.  On each chart I have pre-drawn trend lines on the True Strength Index (TSI) and Money Flow Index (MFI) indicators which are placed below the actual price movement of the stock.  The software I use is freely available at:  FreeStockCharts.com
*
This weekend I identified 7 miners of the 135 that exhibit what I consider optimal buy signals; a breakout of the TSI indicator and usually above the ZERO reading, often accompanied with a breakout of the MFI indicator, and sometimes including a positive divergence between the direction of price and the TSI indicator's movement.
*
I got this fun idea to document how well each of these 7 stocks perform this week by comparing their results with a couple of benchmark ETFs like GDX and GDXJ (Gold Miner and Junior Gold Miner Index, respectively).
*
Following the close each day this week I will return to the table included in this post and update the results.  If you would like to participate as an observer you will need to find this post (as it becomes buried further and further down the page with the addition of new posts) and see for yourself exactly how this turns out.  
*
I guess the question I am exploring is:  Timing is everything (or is it)?  
*
Does using the TSI and MFI for timing buy signals give one any advantage over simply buying either GDX or GDXJ?  (Not that one little study using just 7 stocks during a single week of the year can answer that question once and for all, but hey, we have to start somewhere, right?)
*
TSI (7,4)
MFI (10)
Sun
10/3
Mon
10/4
Tues
10/5
Wed
10/6
Thurs
10/7
Fri
10/8
Cumulative Gain/Loss
So Far This Week
1.
CDY
1.20
+0.83%
0
-.83%
-2.50%
*
-2.50%
2.
JAG
6.75
-0.15%
+2.37
+.72%
-1.29%
*
+1.65%
3.
MQCMF
0.79
-1.35%
-4.45%
+.63%
+3.83%
*
-1.34%
4.
PEZGF
1.59
+1.78%
+2.70%
+2.89%
-5.26%
*
+2.11%
5.
PZG
1.68
-1.79%
+9.70%
0
-1.66%
*
+6.25%
6.
RIC
5.25
-2.29%
+0.19%
-.58%
-4.89%
*
-7.57%
7.
SFEG
1.10
-1.82%
+3.70%
+3.57%
-1.72%
*
+3.73%
Charting software:  www.FreeStockCharts.com

GDX
56.60
-1.86%
+3.08%
+1.50%
-2.65%
*
+0.07%

GDXJ
34.19
-2.49%
+3.96%
+2.16%
-2.99%
*
+0.64%

The average loss for the 7 TSI miners on Monday was -0.68%, GDX was -1.86% and GDXJ  -2.49%.
The average gain for the 7 TSI miners on Tuesday was +2.03%, GDX was +3.08% and GDXJ +3.96%.
The average gain for the 7 TSI miners on Wednesday was +.91%, GDX was +1.50% and GDXJ +2.16%.
The average loss for the 7 TSI miners on Thursday was -1.93%, GDX was -2.65% and GDXJ -2.99%.
For the week so far the 7 TSI miners have averaged +0.08%, GDX +0.02% and GDXJ +0.16%.


Well, here is the table (above) I will return to each day to update for our amusement.
*
The 7 stocks and their charts are as follows:
*
1.  CDY - Cardero Resource Corp
2.  JAG - Jaguar Mining Inc.
3.  MQCMF - Mosquito Cons Gold M
4.  PEZGF - Pediment Gold
5.  PZG - Paramount Gold Mining Corp
6.  RIC - Richmont Mines Inc
7.  SFEG - Santa Fe Gold Corp
*
Click on any chart to ENLARGE
*


Saturday, October 2, 2010

SOLD TWO and BOUGHT FIVE

*
Friday was a busy day of trading for me.  I sold ANO at $1.03 and more CMIN at $0.33.  And I accumulated more shares of  CDY at $1.17, NSU at $4.94, SFMI at $0.15, SILA at $0.80, as well as started a new position in SFEG at $1.09.
*
This first daily chart is of Anooraq Resources Corp (ANO) which I sold at $1.03.  ANO closed at $1.08 with a 21.05% gain for the day, so arguably I sold much too soon.  Indeed, the True Strength Index (TSI) and Money Flow Index (MFI) indicators were just flashing a BUY signal when I sold, not a SELL signal.  
*
What was I thinking to sell so early?  Or, was I thinking?  Fair questions.  I guess I noticed the stock had already gone up 14.61% at the time I sold and as I no longer have time to sit around all day and watch these things, I decided to not press my luck.  
*
This kind of 'inefficient' trade is going to happen to me from time to time due to my full-time employment.  I have already had that discussion with myself and determined that that is acceptable.  And, if I continue to make winning trades, in the long run it is going to all work out anyway, so why kick myself when these kind of things happen?
*
Click on the charts to ENLARGE
*
The other sale was of Constitution Mining Corp (CMIN) at $0.33.  This sale, at a 9.8%  loss, unloads my second of four purchases of CMIN.  Looking at this daily chart, it appears possible that the stock will break out to the upside, which would be fine with me.....but I am not counting on it, obviously. I think what I am going to do is sell the third position, probably at a loss, sometime this upcoming week and then let the fourth and final position ride for a few months and see what happens.  
*
My hunch is that patience will pay off, as it does 98% of the time for mining stocks in a secular bull market.  However, I had too much of this stuff to take that kind of gamble with all four acquisitions....especially when I am quite certain that other stocks, less manipulated and sold short, are going to do extremely well in the mean time.
*
For better or worse I am deciding to take most of my lumps (losses) now and move on.
*
This third daily chart is of Cardero Resource Corp (CDY) and reflects my accumulation of more shares at $1.17.  CDY has $1.06 per share in cash and a tangible book value of $1.62 per share.  ROA = 50.3%, ROE = 65.0% and ROI = 61.6%.  Why in the world this stock is priced so low is really a puzzlement to me, but I am a buyer until the market figures out what I already know.
*
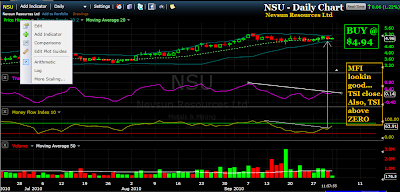
This fourth daily chart is of Nevsun Resources Ltd (NSU) and reflects my accumulation of more shares at $4.94.  The MFI indicator has just broken its trend line and TSI looks very close to a bullish resolution as well.  Price has made a nice saucer consolidation and looks ready for rocket launch.  
*
The mining index ($HUI) tested a major breakout (520) yesterday and when it gets through that price level I expect we are going to see mining stocks scream higher as new hot money enters the sector.  There will no longer be any overhead resistance to price movement for all mining stocks.
*
This fifth daily chart is of Silver Falcon Mining (SFMI) and reflects my accumulation of more shares at $0.15.  In taking this trade I was counting on a bounce off the 200 dma and fortunately, it was an idea that worked.
*
As you can observe from the chart, each time SFMI has bounced off the 200 dma it has produced a trade gain worth as much as 40-50%, and quickly.  So far this purchase is worth 13.3% in a single day and I hope to hang on for a larger gain in the week to come.
*
This sixth daily chart is of Silver America Inc (SILA) and reflects my accumulation of additional shares at $0.80.  This stock appears to be getting ready for some upside as the TSI and MFI are both bullishly breaking their trend lines and the TSI has attained a +0.11 reading.  There was a lot of heavy volume buying last month that pushed price up to and then beyond $1.00.  Since then we have seen reduced selling volume which appears to be waning.  I imagine on a breakout of $HUI 520, SILA will see increased buying volume and could make a strong move for several days, if not longer.....hopefully surpassing the $1.00 price.
*
Finally, this seventh daily chart is of Santa Fe Gold Corp (SFEG) and is a new position for me at $1.09.  This stock has spent a good deal of time consolidating at about 90 cents, finally made an initial move to $1.20 and I am buying it on a pull back and consolidation of that move.  The TSI has turned up above zero, there was heavy buying volume on its initial surge and I think SFEG is now about ready to make its next move.
*
My TSI Trading record has been updated.