*
I have identified no fewer than 6 techniques for using the True Strength Index (TSI) indicator for the accurate generation of Buy/Sell trading decisions.
*
I will present these 6 techniques accompanied by charts and demonstrate their interpretation.
*
The 6 techniques are:
*
1. ZERO Crossover
2. Trend Line Break
3. Positive/Negative Divergence
4. Support/Resistance Line Break
5. Nosebleed/Opposite
6. Moving Average Crossover
*
Let's first begin with the ZERO Crossover, as it demonstrates the wonderfully characteristic 'truth' of the True Strength Index indicator:
*
a.) when the indicator is rising above the ZERO level, price is always also rising.
b.) when the indicator is falling below the ZERO level, price is always also falling.
*

*
This daily chart of the SPY ETF demonstrates the concept that when the TSI indicator is rising above the ZERO level, price is always rising.
*
Click on any chart to ENLARGE

*
This daily chart of the SDS ETF demonstrates the concept that when the TSI indicator is falling below the ZERO level, price is always falling.

*
The 2nd technique is called the Trend Line Break. A Buy signal is generated when a series of descending peaks are connected and the resulting trend line finally runs into an indicator reading that begins to exceed the downward trajectory of the line. This 4 hour chart of the DZZ ETN yields a couple of Buy signal examples using the Trend Line Break technique.

*
The Trend Line Break technique issues a Sell signal when a series of ascending troughs are finally met by an indicator reading that begins to fall below the resulting trend line. This 4 hour chart of the GLD ETF yields a couple of Sell signal examples using the Trend Line Break technique.

*
The 3rd technique is the Positive and Negative Divergence technique.
*
In the case of a positive divergence, price either holds sideways or makes a lower low, while the True Strength Index indicator simultaneously makes a higher low. What is going on here is that momentum (TSI) is improving while price seems to be going nowhere. This disagreement or divergence in direction is positive for the ongoing direction of price. This 60 minute chart uses the GLD ETF to demonstrate a rising TSI that is diverging in a favorable or positive manner from price.
*
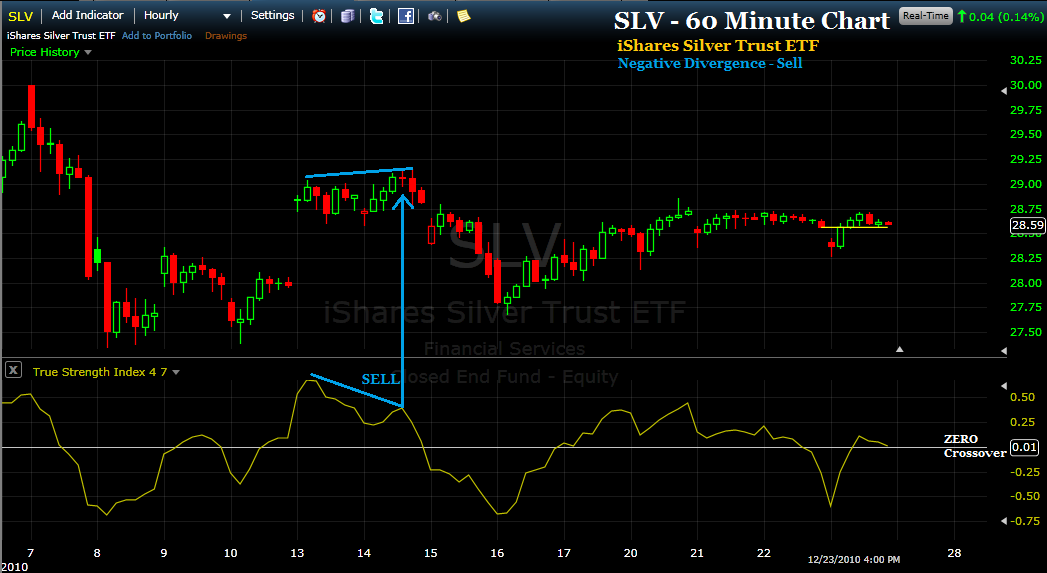
A negative divergence Sell signal occurs when price trades sideways or even makes a slightly higher high, while momentum (TSI) concurrently makes a lower high. In this case, price appears to be either stable or improving, while the TSI, making a lower high, tells us that momentum is becoming exhausted. The difference in direction, the divergence, therefore portends a negative outcome for price. This 60 minute chart of the SLV ETF shows us how price usually resolves after a negative divergence setup.

*
The 4th technique for generating Buy/Sell signals using the True Strength Index (TSI) indicator involves the careful observation of the indicator's horizontal lines of support and resistance.
*
This daily chart of the GLD ETF illustrates the Sell signal generated when the horizontal support of the TSI is broken to the downside.

*
This daily chart of the SPY ETF gives us 4 Buy signs when the resistance level of previous high readings of the indicator are surpassed.
*
The 5th technique is what I call 'Nose Bleed' and 'its opposite'. There are times when the TSI screams higher to reach a level comparatively out of context with the recent past. Also, it happens in the 'opposite' manner where the TSI reaches low levels that are, contrasted with recent behavior, simply off the standard deviation chart. These situations, where the TSI movement exceeds the 'norm' themselves generate Buy and Sell signals.

*
This daily chart of the SPY ETF yields an example of the nosebleed Sell signal and 'its opposite' - the excessively low reading that generates a Buy signal.
*
Finally, the 6th technique involves the use of a moving average on the TSI indicator. The crossovers of the indicator with the moving average create the Buy and Sell signals.

*
This 4 hour chart of the UUP ETF arbitrarily uses a 9 period moving average to generate the Buy and Sell signals identified.
*
While I have identified no fewer than 6 separate techniques for using the True Strength Index (TSI) indicator, I find that the the trades with the highest probability for success will combine two, three and sometimes even 4 techniques. An example of this would include a Buy signal occurring just above the ZERO crossover as a result of a trend line break with a positive divergence in the previous bars.
*
Probabilities for a successful trade are also raised when additional indicators are combined with the TSI to provide confirmation of likely change in price direction. The indicators I often combine with the True Strength Index for this purpose include the Money Flow Index, Demand Index, and the Volume Flow Indicator. My idea here is to use other indicators that measure something a bit different from momentum, such as those that calculate volume, volatility or some metric other than momentum.
*
The True Strength Index (TSI) indicator is freely available via the Internet based charting software at FreeStockCharts.
*
I am open to answering questions and providing assistance to anyone interested in becoming more proficient at using the True Strength Index (TSI) indicator. Just write me an email with your questions, OK?
*
John

![[Most Recent Quotes from www.kitco.com]](http://www.kitconet.com/images/quotes_special.gif)


No comments:
Post a Comment