
Just for a change of pace and to practice my skills on something other than mining stocks, I decided to take a hard look at about 100 Exchange Traded Funds (ETF) and see how the market looks going into next week.
*
The ETF's with the most compelling setups were invariably those with a bearish bias. So I have got to imagine there will be some downdrafts in the stock market this week.
*
This first chart is Direxion Daily Real Estate Bear 3X (DRV). Now if I were to buy this one in the upcoming week, the 60 minute chart (not shown - but you can make your own at FreeStockCharts) would have to show me a new attitude. At the moment, the True Strength Index (TSI) indicator says price will continue lower, at least initially, on Monday.
*
Click on the charts to ENLARGE

This second chart is Direxion Daily Emerging Markets Bear 3X (EDZ). This one needs to move higher at least 5% just to fill a little gap left open from 5 or 6 days ago. The hourly TSI looks pretty good so if I saw price and the TSI turn north after the open, I would be inclined to buy.

This third chart is Direxion Financial Bear 3X Shares (FAZ). Believe it or not, I have a true aversion to having anything to do with trading anything related to the financial stocks. Call it a bad attitude on my part, I guess. That sector seems so incredibly rigged that I just refuse to screw around with it. But for the reader with a better attitude than mine, this could be worth keeping in mind.
*
The hourly TSI charts says downside momentum will be a problem on Monday. To buy this I would have to see the hourly chart get it's act together. If FAZ trades down to $13.00 fairly quickly, that will put a nice positive divergence in place and I could be a buyer of that.

This fourth chart is Direxion Daily Latin Amer Bear 3X (LHB). The hourly chart on this one has been strengthening for 5 days now and I would be kinda surprised if price holds still much longer.

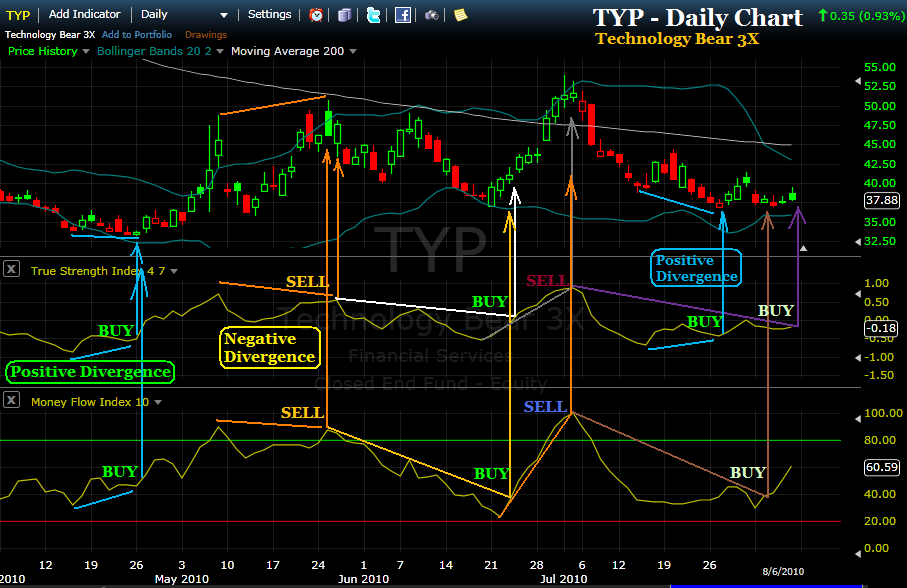
And finally, the sixth chart is Technology Bear 3X (TYP). Like so many of the others above, the 60 minute TSI would not encourage an immediate purchase of this. If/when the 60 minute has either a trend line break or a significant positive divergence in place, THEN this could be a very nice BUY.
*
To wrap up my little exercise session, I would suggest the stock market could be in for some bouncing around this week. I would not have the immediate confidence to buy any of these 6 on the open Monday, unless perhaps the market opens with a very significant gap to the upside. Even then, I would definitely give it careful thought. I do however think if a person monitored these 6 this week, there would be good opportunities to make 5-10% on any one of them.

![[Most Recent Quotes from www.kitco.com]](http://www.kitconet.com/images/quotes_special.gif)


Price erosion in leveraged ETF's is pretty bad.
ReplyDeletehttp://seekingalpha.com/article/127365-leveraged-etfs-handle-with-care
I hope you won't hold them for more than a couple days.
Yeah, the 5-10% I may attempt to make on any one of these would definitely be a surgical technical maneuver, not a buy and hold until Christmas type of thing.
ReplyDelete