Here are a couple of interesting charts I made at a site you should check out sometime: IndexIndicators
*
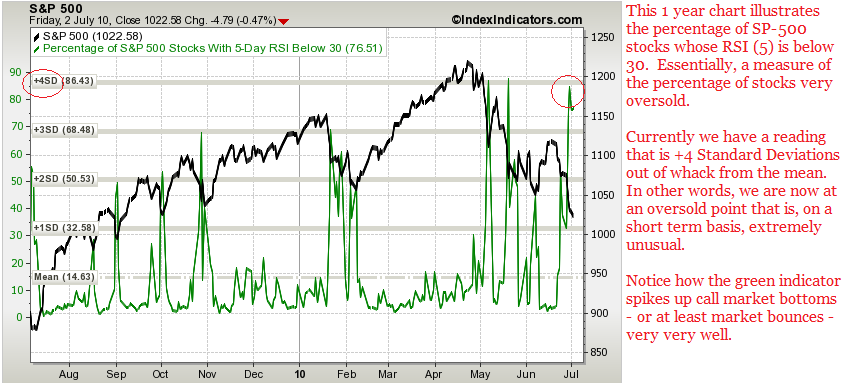
This first one year daily chart of the SP-500 details both price and a measurement in terms of standard deviation of the RSI (5) indicator setting. In effect, this chart shows us how "unusually" oversold the SP-500 currently is, as well as how the index of 500 stocks has reacted in the past one year to similar situations.
*
Click on the chart to ENLARGE
*

*
Extremely spikes in the VIX have tended to call market bottoms accurately in the past. Perhaps we are now set up for another market bottom. See what you think.
*
Click on the chart to ENLARGE

![[Most Recent Quotes from www.kitco.com]](http://www.kitconet.com/images/quotes_special.gif)


No comments:
Post a Comment